
Veterinary Industry Summary: October 25 – 31, 2026

Stats from the Veterinary Industry Tracker powered by Vetsource and AVMA
October 25 – 31, 2026
Check out the Veterinary Industry Tracker(opens in new tab) for daily stats.
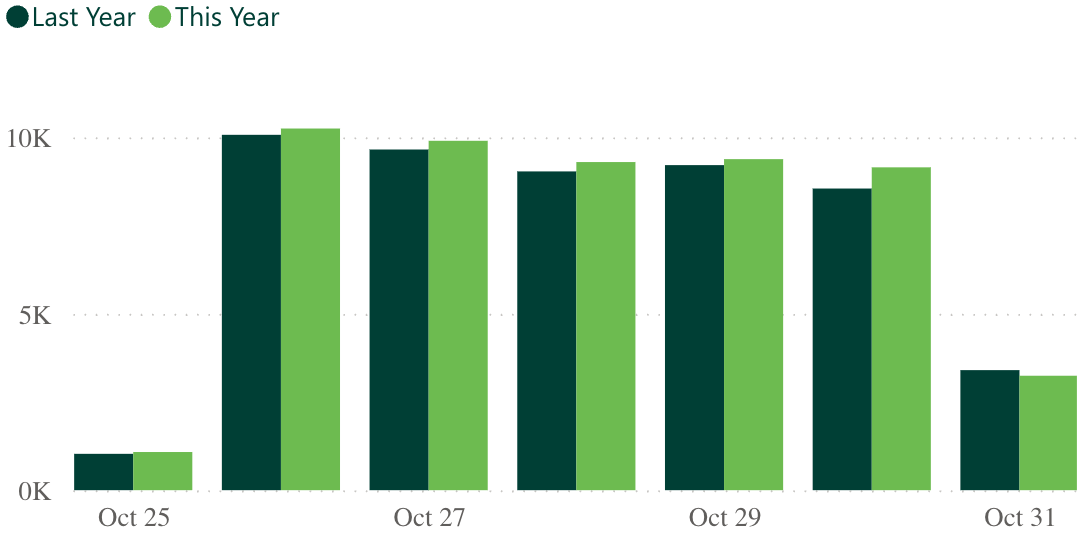
| 2.7% Revenue YoY (Last Week) |
-1.5% Visits YoY (Last Week) |
Industry revenue and visits both increased this week compared to the week prior, with revenue rising to 2.7% from 1.5%, and visits rose from -3.2% to -1.5%.
 -8.7% Heartworm YoY |
-7.6% Flea/Tick YoY |
 3.7% Services YoY |
-1.4% Products YoY |
Parasiticides, services, and products all rose last week compared to the prior week. Heartworm increased from -9.5% to -8.7%, flea/tick jumped from -10.1% to -7.6%, services saw a slight uptick from 2.9% to 3.7%, and products rose from -3.7% to -1.4%.
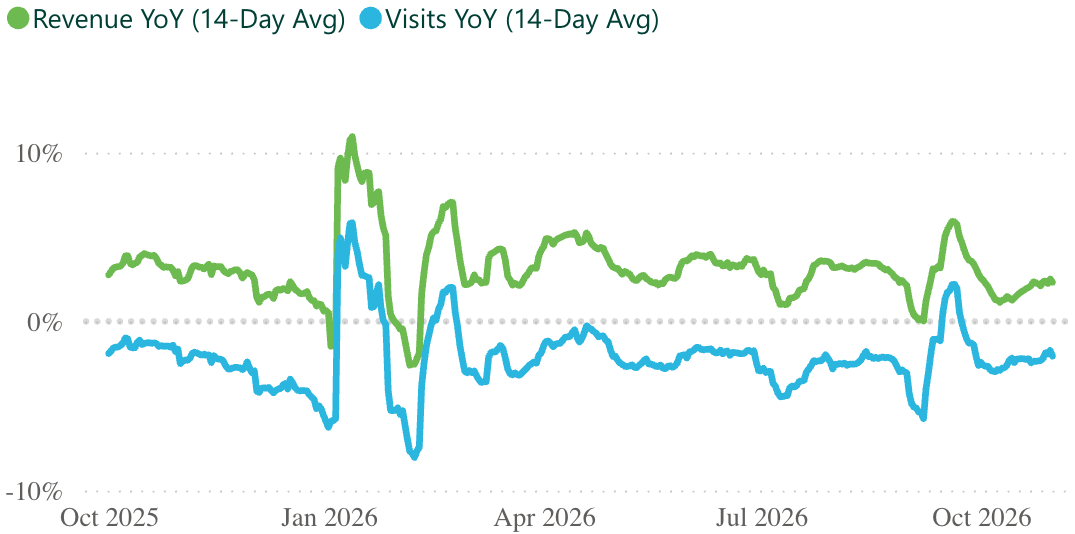
| +3.4% Revenue YoY (Last 12 Months) |
-2.0% Visits YoY (Last 12 Months) |
The 12-month trendlines show revenue and visits steadily climbing since mid-October.
| 6,356 Practices |
2.2M Revenue per practice (Last 12 months) |
9.6K Visits per practice (Last 12 months) |
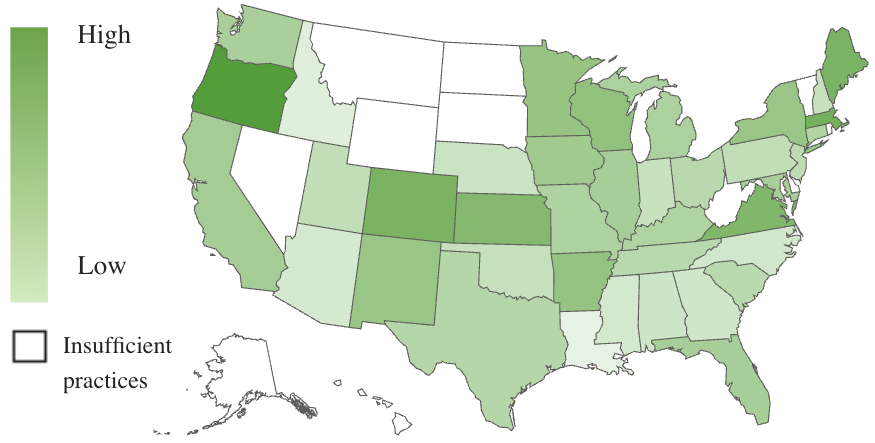
Oregon continues to lead revenue growth at 7.2%, with Massachusetts in second at 5.8%. Colorado and Maine are tied for third at 5.6%.
Oregon is once again the only state with positive YoY visits, at 1.7%.
*Numbers are subject to change based on data availability and PIMS adjustments.

Need additional stats? You got it.
The Premium Veterinary Industry Tracker lets you drill into revenue categories, visit types, date ranges, states, and more.
| LEARN MORE »(opens in new tab) |