
Veterinary Industry Summary: October 18 – 24, 2026

Stats from the Veterinary Industry Tracker powered by Vetsource and AVMA
October 18 – 24, 2026
According to the 2026 AVMA Practice Owners Survey(opens in new tab), average U.S. veterinary gross revenue rose 0.3% (in inflation-adjusted terms) to roughly $1.6 million in 2025. However, gross revenue per square foot dropped from $528 to $513.
Frederic B. Ouedraogo, PhD, senior economist at AVMA, noted that “from an efficiency standpoint, this downward slope is concerning.” Earnings were primarily driven by examinations and consultations, generating 25 cents of every dollar.
Average active clients grew to 4,087 per clinic; however, daily patient visits per veterinarian stagnated or declined due to reduced consumer spending.
Dr. Ouedraogo emphasized the importance of practice owners collecting their own data to gain insights, identify areas for improvement, and set goals. He also recommended practices create a spreadsheet to track relevant data and update goals based on trends.
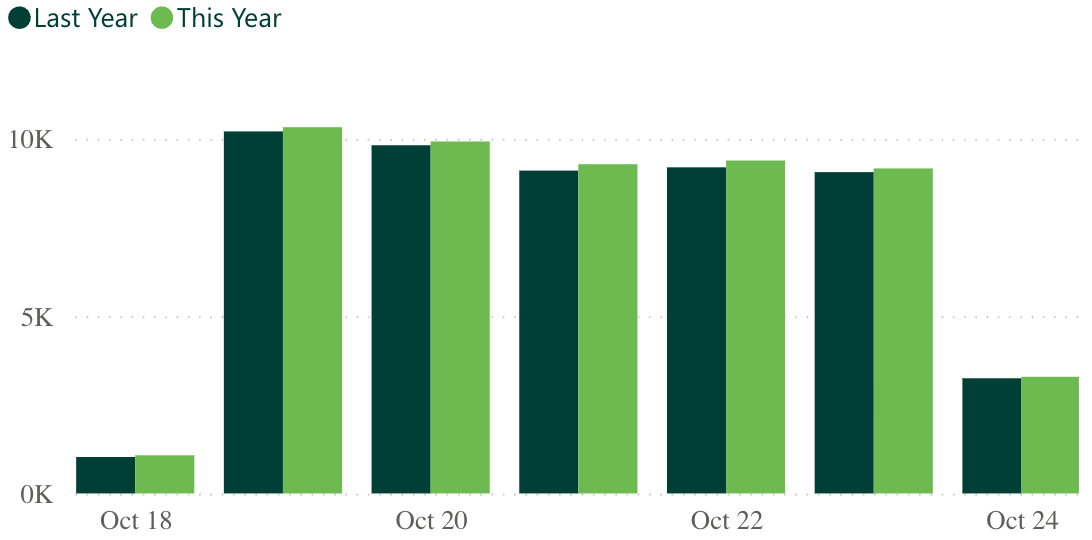
| 1.5% Revenue YoY (Last Week) |
-3.2% Visits YoY (Last Week) |
Industry revenue saw a slight uptick last week compared to the week prior, rising from 1.3% to 1.5%. Visits decreased from -3.0% to -3.2% in the same time period.
 -9.5% Heartworm YoY |
-10.1% Flea/Tick YoY |
 2.9% Services YoY |
-3.7% Products YoY |
Heartworm saw a slight increase last week compared to the week prior, from -10.0% to -9.5%. Meanwhile, flea/tick dipped from -9.8% to -10.1%.
Services and products both experienced a minor increase, with services rising from 2.6% to 2.9%, and products increasing from -3.8% to -3.7%.
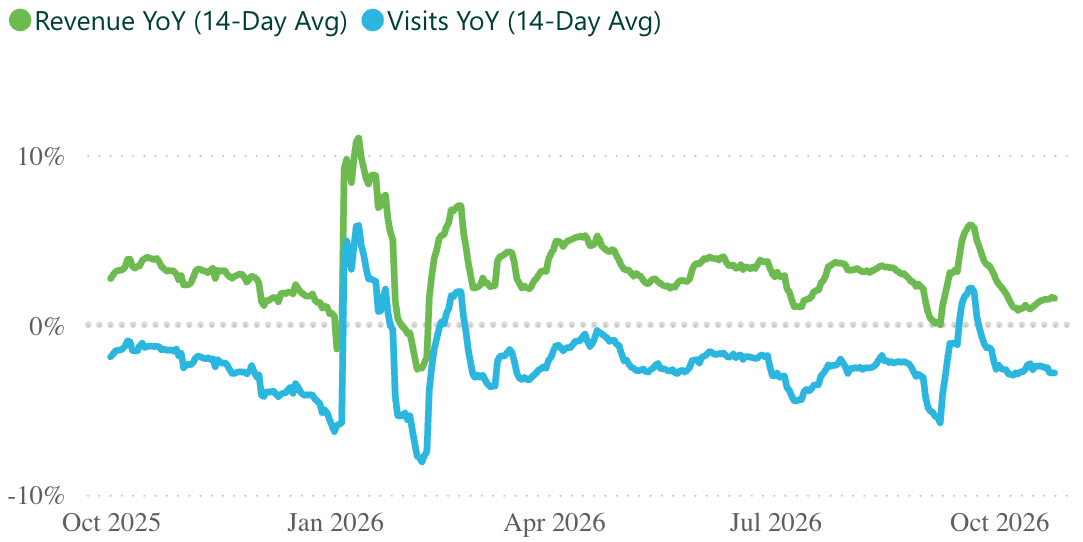
| +3.4% Revenue YoY (Last 12 Months) |
-2.0% Visits YoY (Last 12 Months) |
The 12-month trendlines show revenue and visits stabilizing this month.
| 6,365 Practices |
2.2M Revenue per practice (Last 12 months) |
9.6K Visits per practice (Last 12 months) |
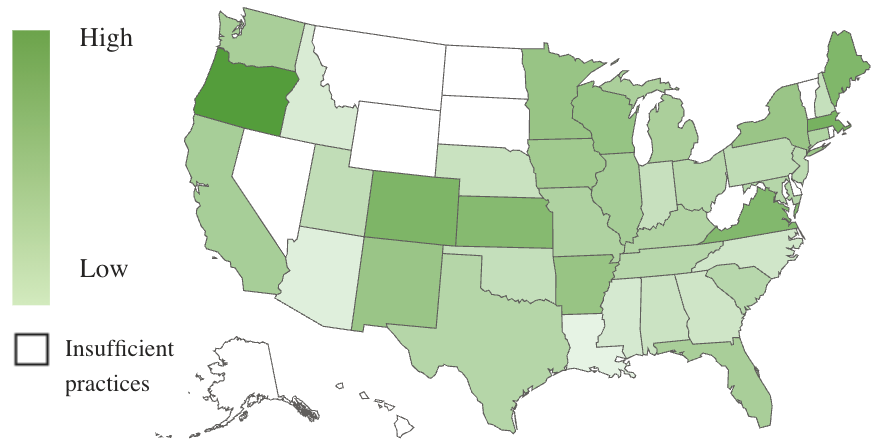
Oregon once again leads revenue growth at 7.3%, with Massachusetts and Colorado behind at 5.8% and 5.5%, respectively.
Like the last few weeks, Oregon is the only state with positive YoY visits, at 1.8%.
*Numbers are subject to change based on data availability and PIMS adjustments.

Need additional stats? You got it.
The Premium Veterinary Industry Tracker lets you drill into revenue categories, visit types, date ranges, states, and more.
| LEARN MORE »(opens in new tab) |