
Veterinary Industry Summary: June 28-July 4, 2026

Stats from the Veterinary Industry Tracker powered by Vetsource and AVMA
June 28-July 4, 2026
Tractor Supply has acquired mobile veterinary care provider VIP Petcare from PetIQ, strengthening the retailer’s in-house pet health platform. The move joins VIP Petcare’s network of about 2,500 contracted veterinarians with Tractor Supply’s existing portfolio, which includes the recently launched Tractor Supply Rx, online pet pharmacy Allivet, and specialty pet retailer Petsense.
According to Dr. Christine Merle at Brakke Consulting, the acquisition sets up Tractor Supply as “a formidable challenger to Chewy’s veterinary ecosystem that they are building with their recent acquisitions of Modern Animal and Smart Equine with a few notable differences — in customer positioning and the value of brick and mortar.”
Check out the Veterinary Industry Tracker for daily stats.
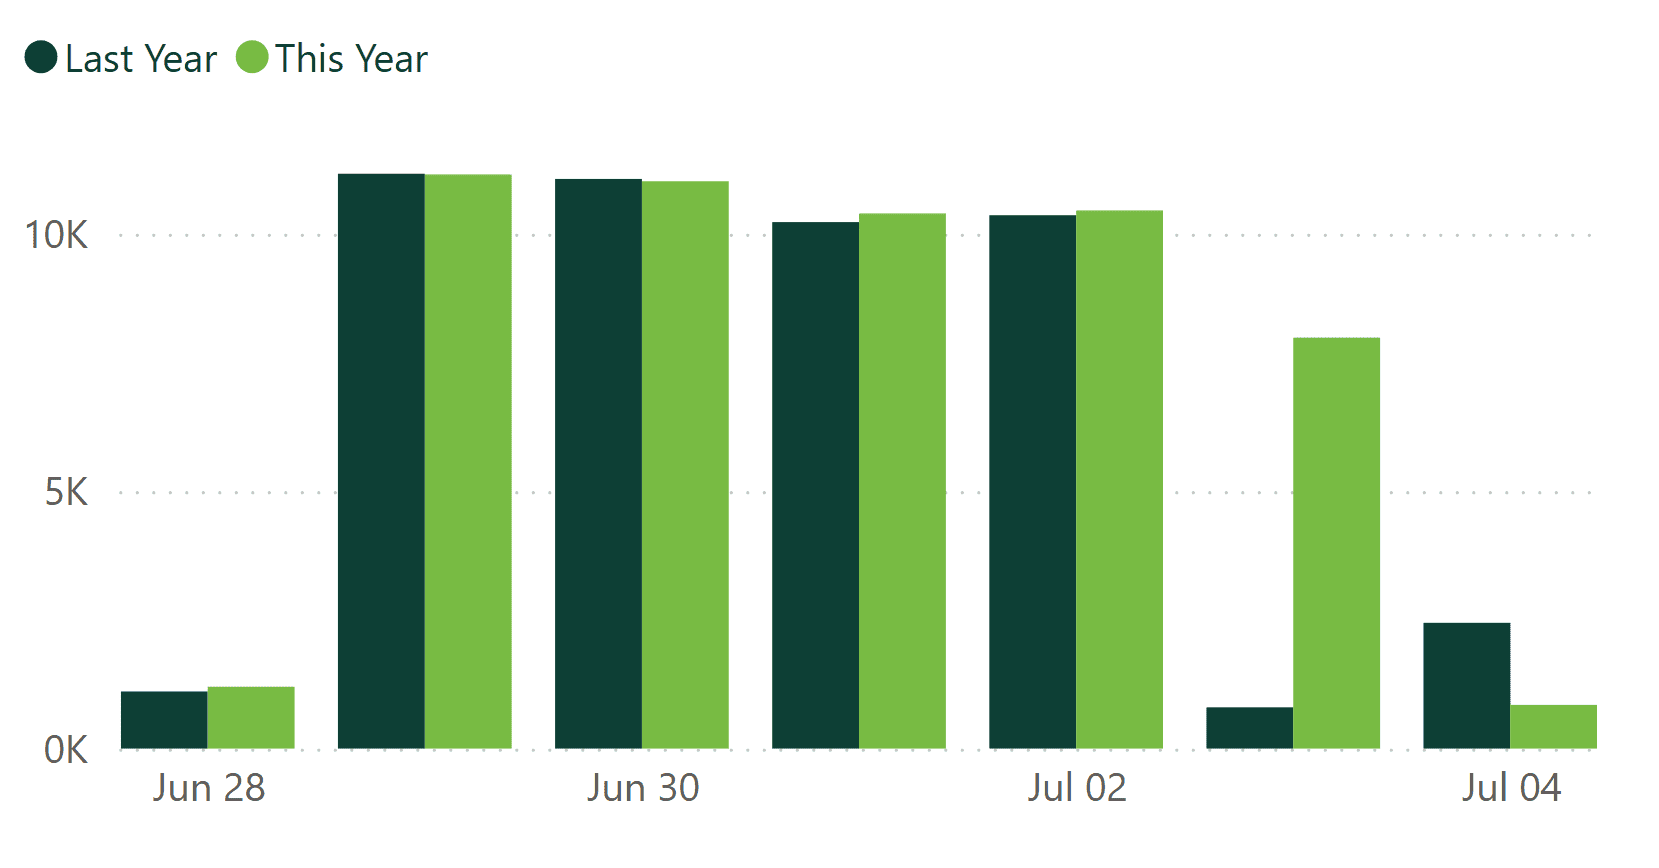
| 12.5% Revenue YoY (Last Week) |
7.5% Visits YoY (Last Week) |
Year-over-year veterinary industry revenue saw a significant boost last week, rising from 2.0% to 12.5%. Meanwhile, veterinary industry visits jumped from -3.2% to 7.5% in the same time period.
Note: These and other sharp rises are due to the timing of the federal holiday.
 1.7% 1.7%Heartworm YoY |
5.8% Flea/Tick YoY |
| 13.8% Services YoY |
8.0% Products YoY |
Last week, all categories saw growth compared to the previous week. Heartworm protection improved from -7.8% to 1.7%, and flea/tick increased from -3.3% to 5.8%.
Services and products also saw significant gains, rising from 3.1% to 13.8% and -1.7% to 8.0%, respectively.
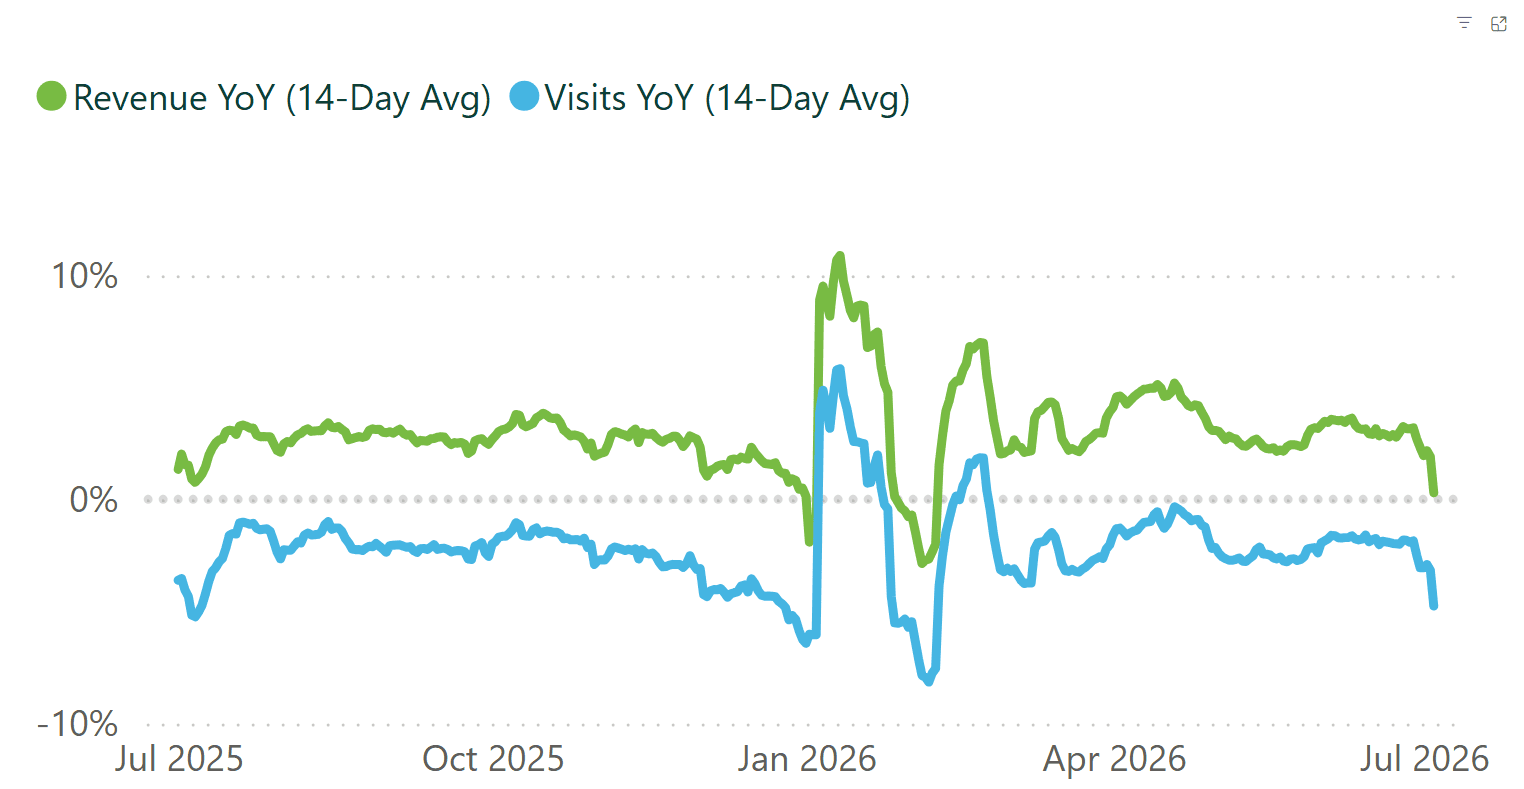
| +3.2% Revenue YoY (Last 12 Months) |
-2.1% Visits YoY (Last 12 Months) |
The rolling 14-day trendline shows a sharper decline in revenue and visits since the end of June.
| 6,619 Practices |
2.2M Revenue per practice (Last 12 months) |
9.7K Visits per practice (Last 12 months) |
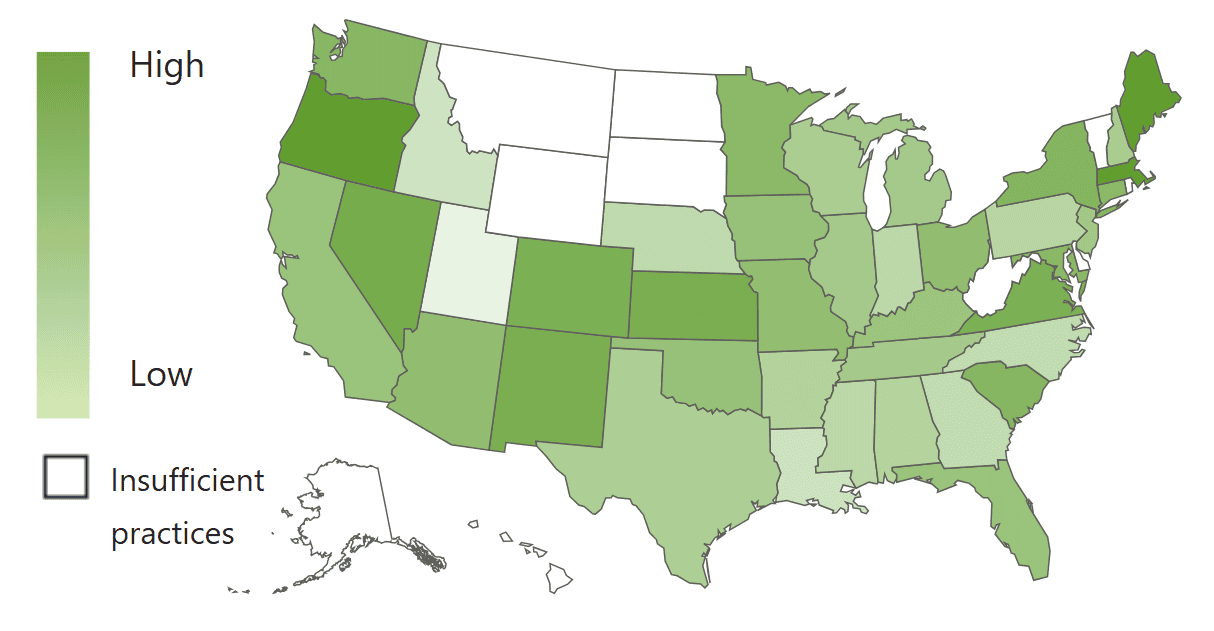
Massachusetts takes the lead in year-over-year revenue at 5.8%, with Maine and Oregon tied for close second at 5.7%.
Oregon remains in the lead for year-over-year visits at 0.6%, with Nevada just behind at 0.4%. Coming in third, Kansas trails behind at -0.6%.
*Numbers are subject to change based on data availability and PIMS adjustments.

Need additional stats? You got it.
The Premium Veterinary Industry Tracker lets you drill into revenue categories, visit types, date ranges, states, and more.
| LEARN MORE » |