
Veterinary Industry Summary: July 5-11, 2026

Stats from the Veterinary Industry Tracker powered by Vetsource and AVMA
July 5-11, 2026
The U.S. Department of Education has proposed regulations to overhaul higher education accreditation by changing how agencies like the AVMA Council on Education (AVMA COE) are able to operate. Under the new rules, which could take effect next summer, agencies will be banned from sharing resources with affiliated professional associations and employed academics would be barred from voting on policies, which could raise university fees to support independent accrediting bodies.
This transition could heavily impact specialized fields such as dentistry, medicine, and optometry, which rely on shared resources. Accreditors will also be required to establish standards evaluating academic freedom, intellectual diversity, and student success metrics such as graduation rates and licensure exams. Read the full statement.
Check out the Veterinary Industry Tracker for daily stats.
| -0.8% Revenue YoY (Last Week) |
-5.2% Visits YoY (Last Week) |
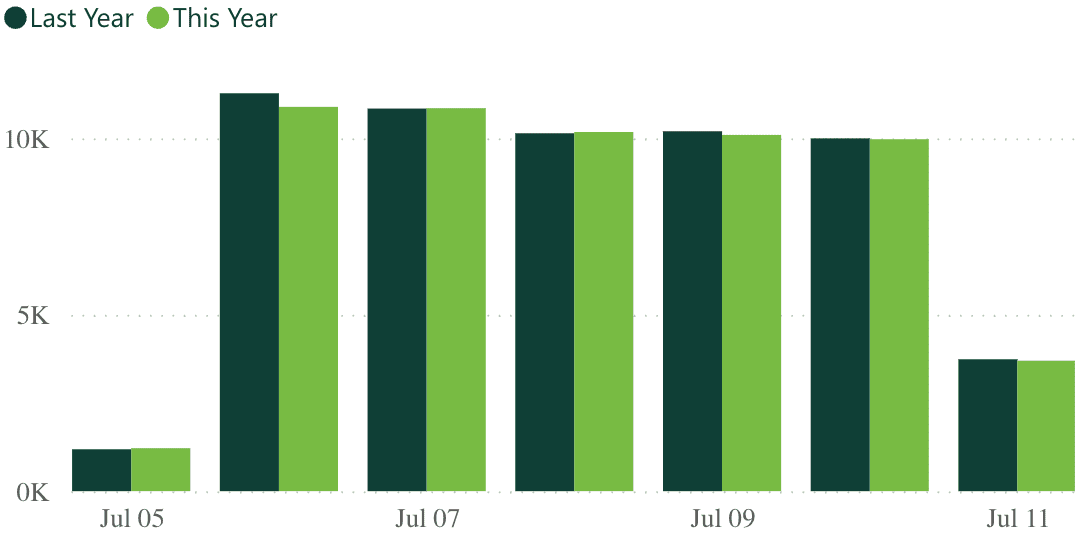
After a sharp rise due to the federal holiday the week prior, stats have dropped. Industry revenue was at -0.8% last week compared to 12.5% the prior week, and visits dropped from 7.5% to -5.2% in the same time frame.
 -10.6% -10.6%Heartworm YoY |
-6.4% Flea/Tick YoY |
 0.3% 0.3%Services YoY |
-4.7% Products YoY |
All categories took a dive last week compared to the previous week, due to the timing of the federal holiday. Heartworm fell from 1.7% to -10.6%, and flea/tick decreased from 5.8% to -6.4%. Services and products also dipped, falling from 13.8% to 0.3% and 8.0% to -4.7%, respectively.
| +3.2% Revenue YoY (Last 12 Months) |
-2.1% Visits YoY (Last 12 Months) |
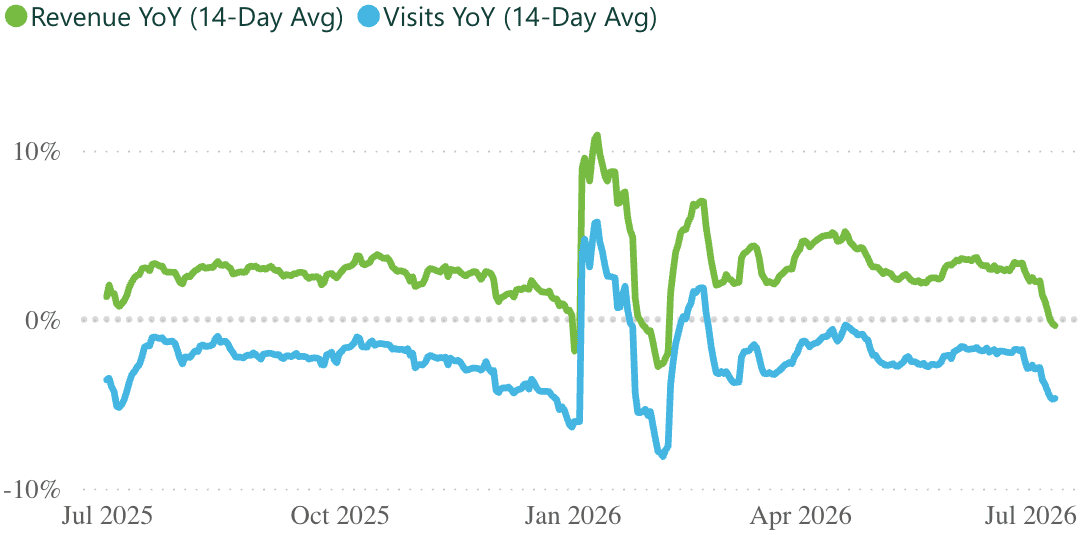
The rolling 14-day trendline shows a sharp decline in revenue and visits since the beginning of July.
| 6,545 Practices |
2.2M Revenue per practice (Last 12 months) |
9.7K Visits per practice (Last 12 months) |
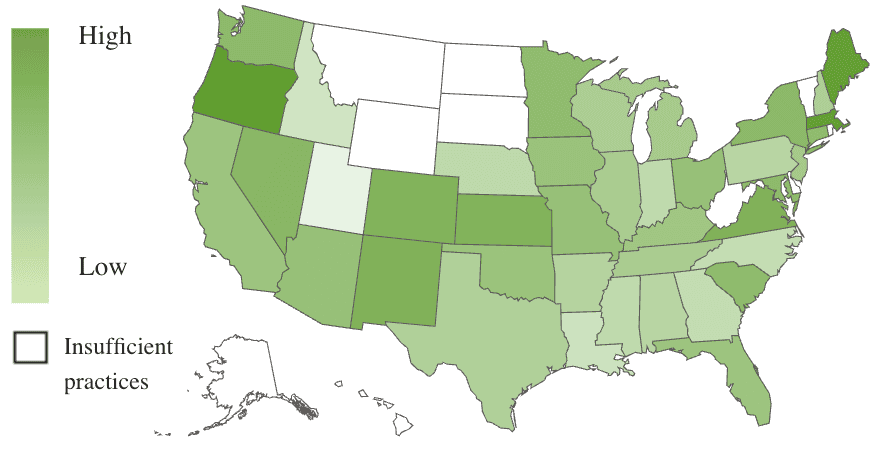
Oregon has taken the lead in year-over-year revenue at 6.0%, with Massachusetts in second at 5.8%, and Maine in third with 5.7%.
Oregon also leads year-over-year visits at 0.9%, with Nevada behind at -0.3%, and Minnesota trailing at -0.6%.
*Numbers are subject to change based on data availability and PIMS adjustments.

Need additional stats? You got it.
The Premium Veterinary Industry Tracker lets you drill into revenue categories, visit types, date ranges, states, and more.
| LEARN MORE » |