
Veterinary Industry Summary: July 19-25, 2026

Stats from the Veterinary Industry Tracker powered by Vetsource and AVMA
July 19-25, 2026
CVS Health announced last week they are now dispensing common prescription medications for cats and dogs. Pet owners can fill prescriptions for select treatments including antibiotics, pain relievers, preventatives, allergy medications, and more at their local pharmacy or use the CVS Health app to place an order for in-store pickup or delivery.
“With the addition of pet medication dispensing, CVS Pharmacy can now serve every member of the family,” said Sid Tenneti, Senior Vice President and Interim President of Pharmacy and Consumer Wellness at CVS Health. Alongside prescription fulfillment, CVS is also expanding its retail pet offerings.
Check out the Veterinary Industry Tracker for daily stats.
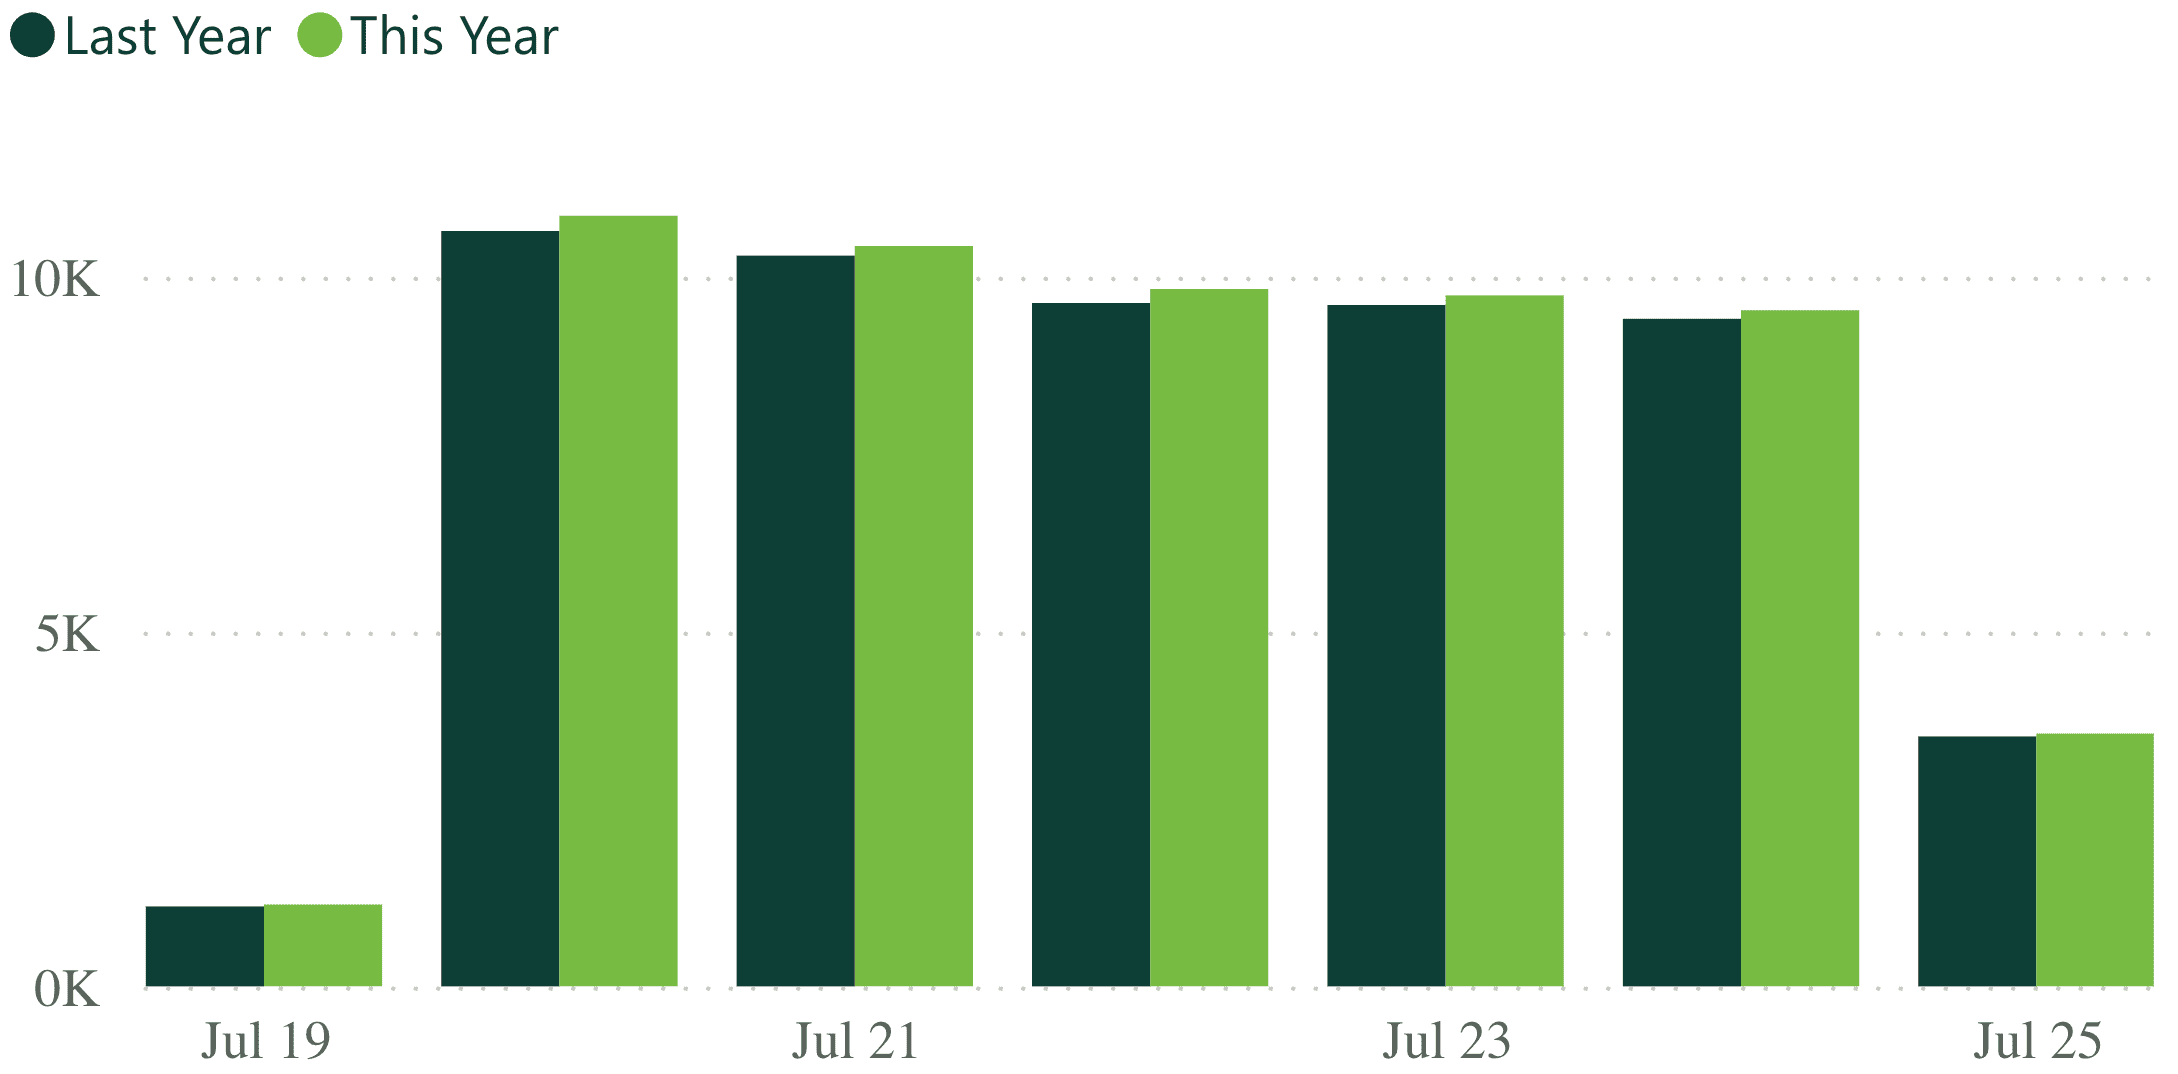
| 1.6% Revenue YoY (Last Week) |
-2.9% Visits YoY (Last Week) |
Both industry revenue and visits saw a slight increase last week compared to the week prior, with revenue going up from 0.7% to 1.6%, and visits increasing from -3.9% to -2.9%.
 -9.0% -9.0%Heartworm YoY |
-5.0% Flea/Tick YoY |
 2.7% 2.7%Services YoY |
-2.4% Products YoY |
Heartworm remained at -9.0% last week, the same as the week prior. In the same time period, flea/tick slightly rose from -5.8% to -5.0%, services rose from 1.6% to 2.7%, and products saw a minor increase from -2.7% to -2.4%.
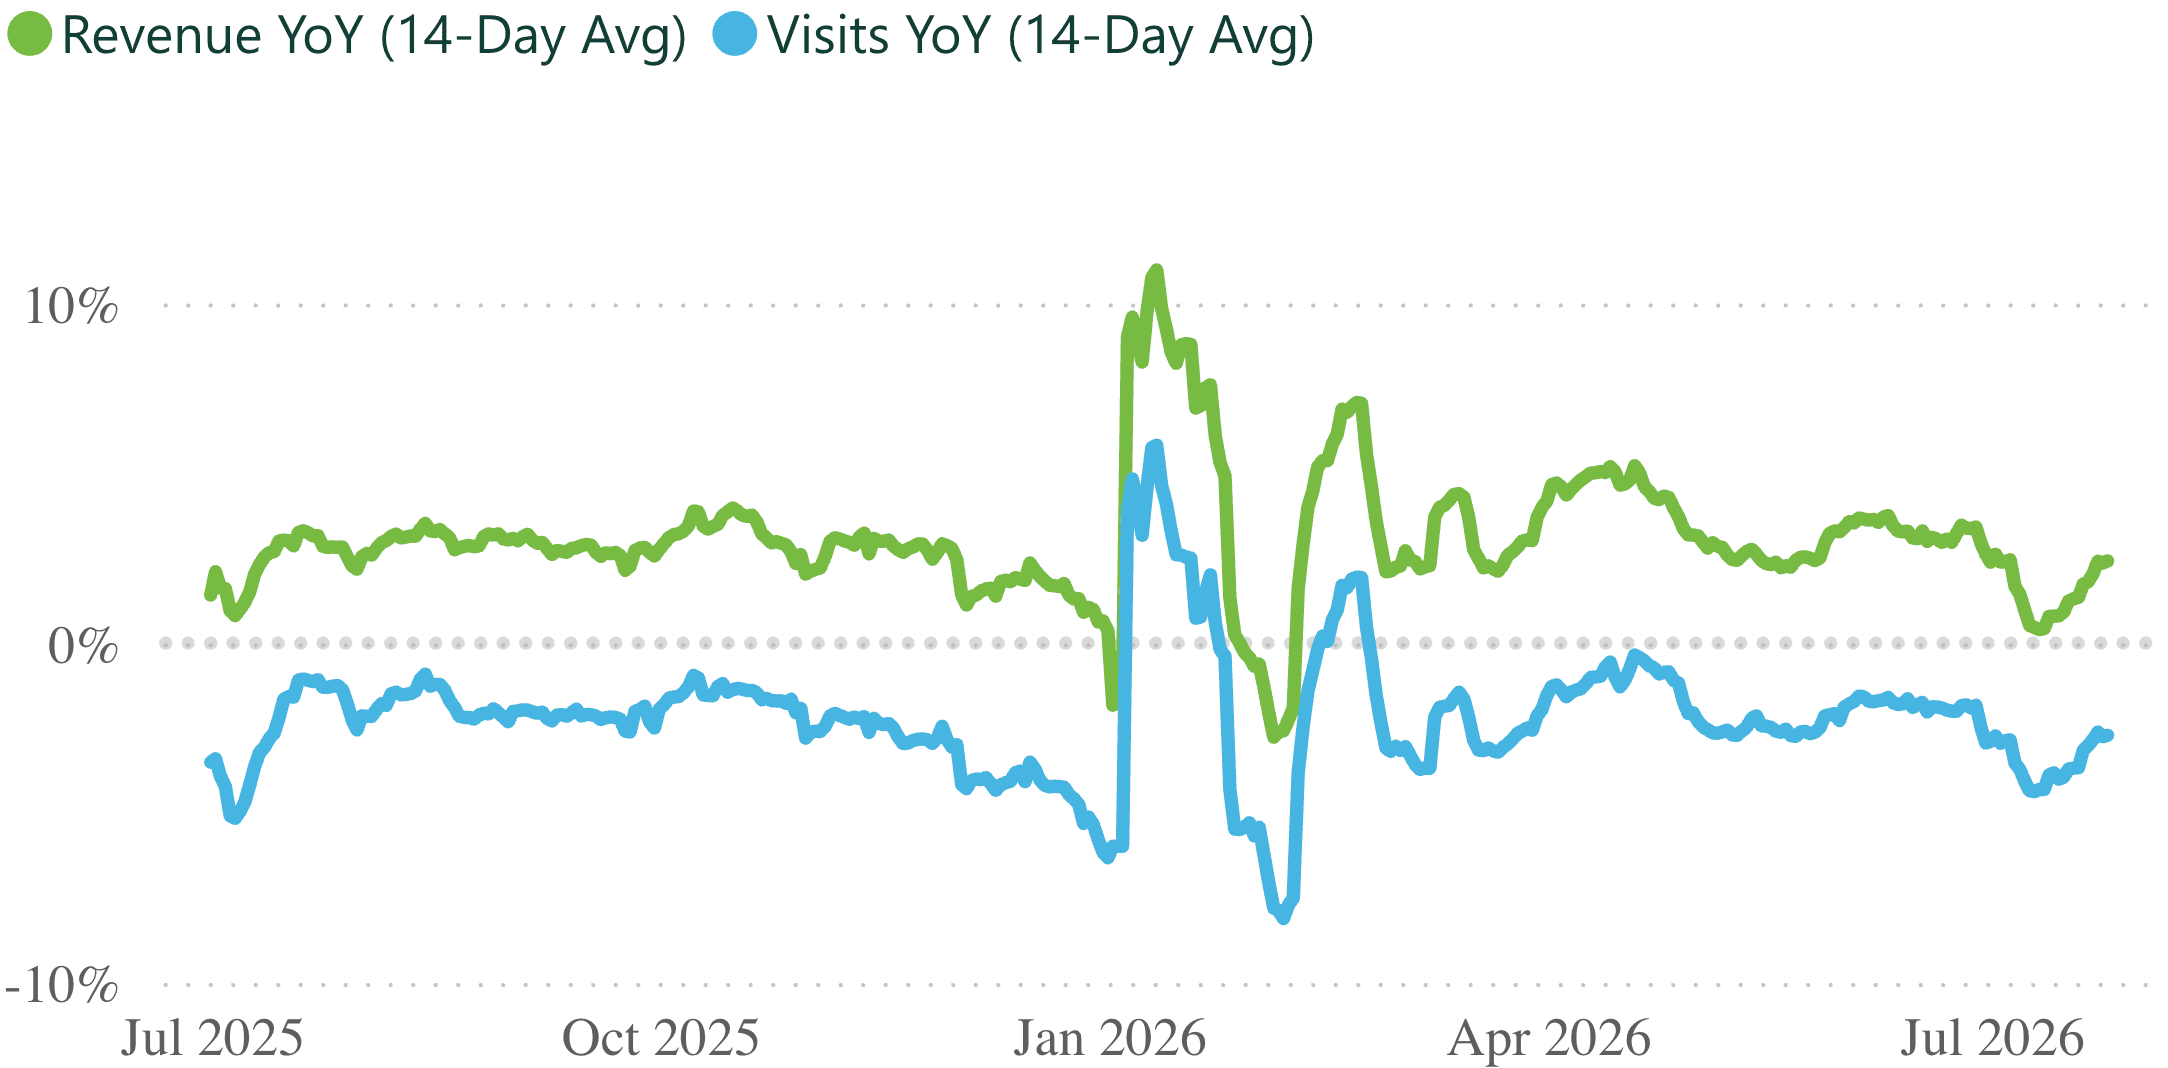
| +3.3% Revenue YoY (Last 12 Months) |
-2.1% Visits YoY (Last 12 Months) |
The rolling 14-day trendline shows revenue and visits steadily climbing since mid-July.
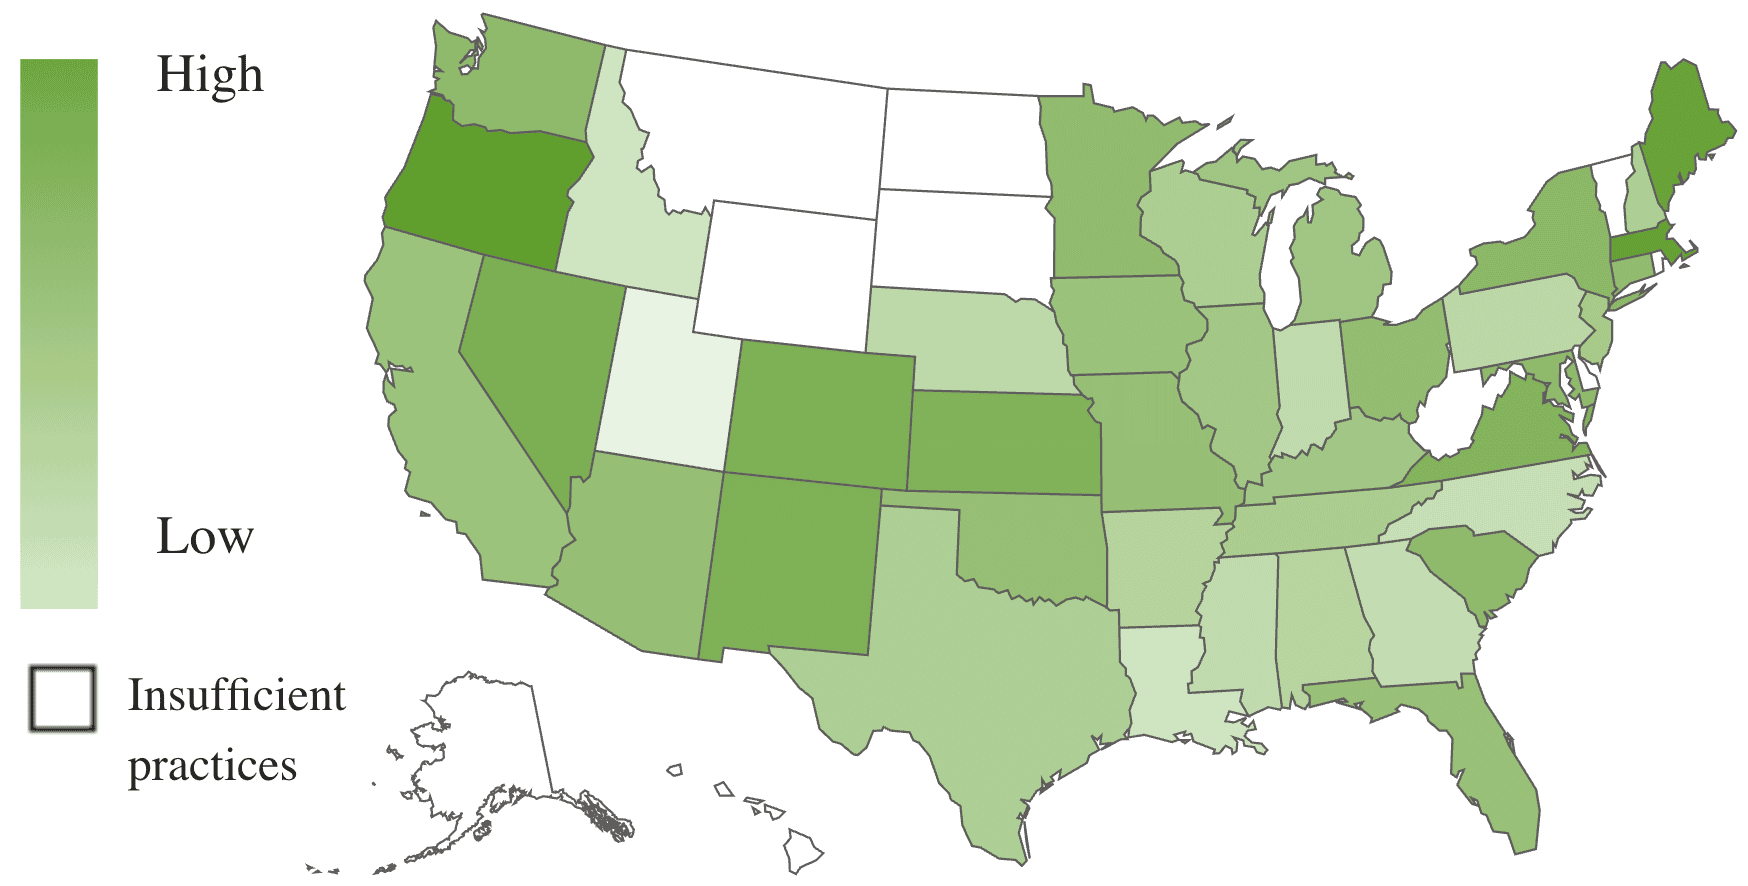
| 6,468 Practices |
2.2M Revenue per practice (Last 12 months) |
9.7K Visits per practice (Last 12 months) |
Oregon maintains the lead in year-over-year revenue at 6.0%. Massachusetts is in second with 5.8%, and Maine right behind at 5.7%.
Once again, Oregon leads year-over-year visits at 0.8%. Nevada and Minnesota are in second and third, at 0.4% and -0.6% respectively.
*Numbers are subject to change based on data availability and PIMS adjustments.

Need additional stats? You got it.
The Premium Veterinary Industry Tracker lets you drill into revenue categories, visit types, date ranges, states, and more.
| LEARN MORE » |