
Veterinary Industry Summary: July 12-18, 2026

Stats from the Veterinary Industry Tracker powered by Vetsource and AVMA
July 12-18, 2026
CATalyst Council has released the second edition of “Puppocalypse, Kitten Craze, and the Expectations Reset,” projecting a −2% to −1% annual contraction in U.S. veterinary clinic visits through 2035. Updated with Q2 2026 data and published as a slide presentation, the report reinforces that the expected 2% to 3% industry growth targets remain unrealistic.
The update shows a 10.5% year-over-year drop in puppy visits in Q2 2026, extending a four-year decline, while kitten visits saw a 1.3% uptick. The council’s 2026 State of the Cat household survey confirmed a deficit of young dogs entering U.S. homes, corroborating the forecast. Developed with Vetsource, Kynetec, and Dedekind Cut Labs, the report highlights veterinary service inflation and housing shifts as possible causes, while noting the steepest visit decline, −2.2%, is projected for fiscal year 2027.
“Cats remain a clear bright spot,” said Gina Fortunato, executive director at CATalyst Council. “The second edition doesn’t change that story: about a third of household cats visit the veterinarian each year and closing that medicalization gap is the largest organic growth opportunity most practices have, regardless of what happens with puppy demographics.”
Check out the Veterinary Industry Tracker for daily stats.
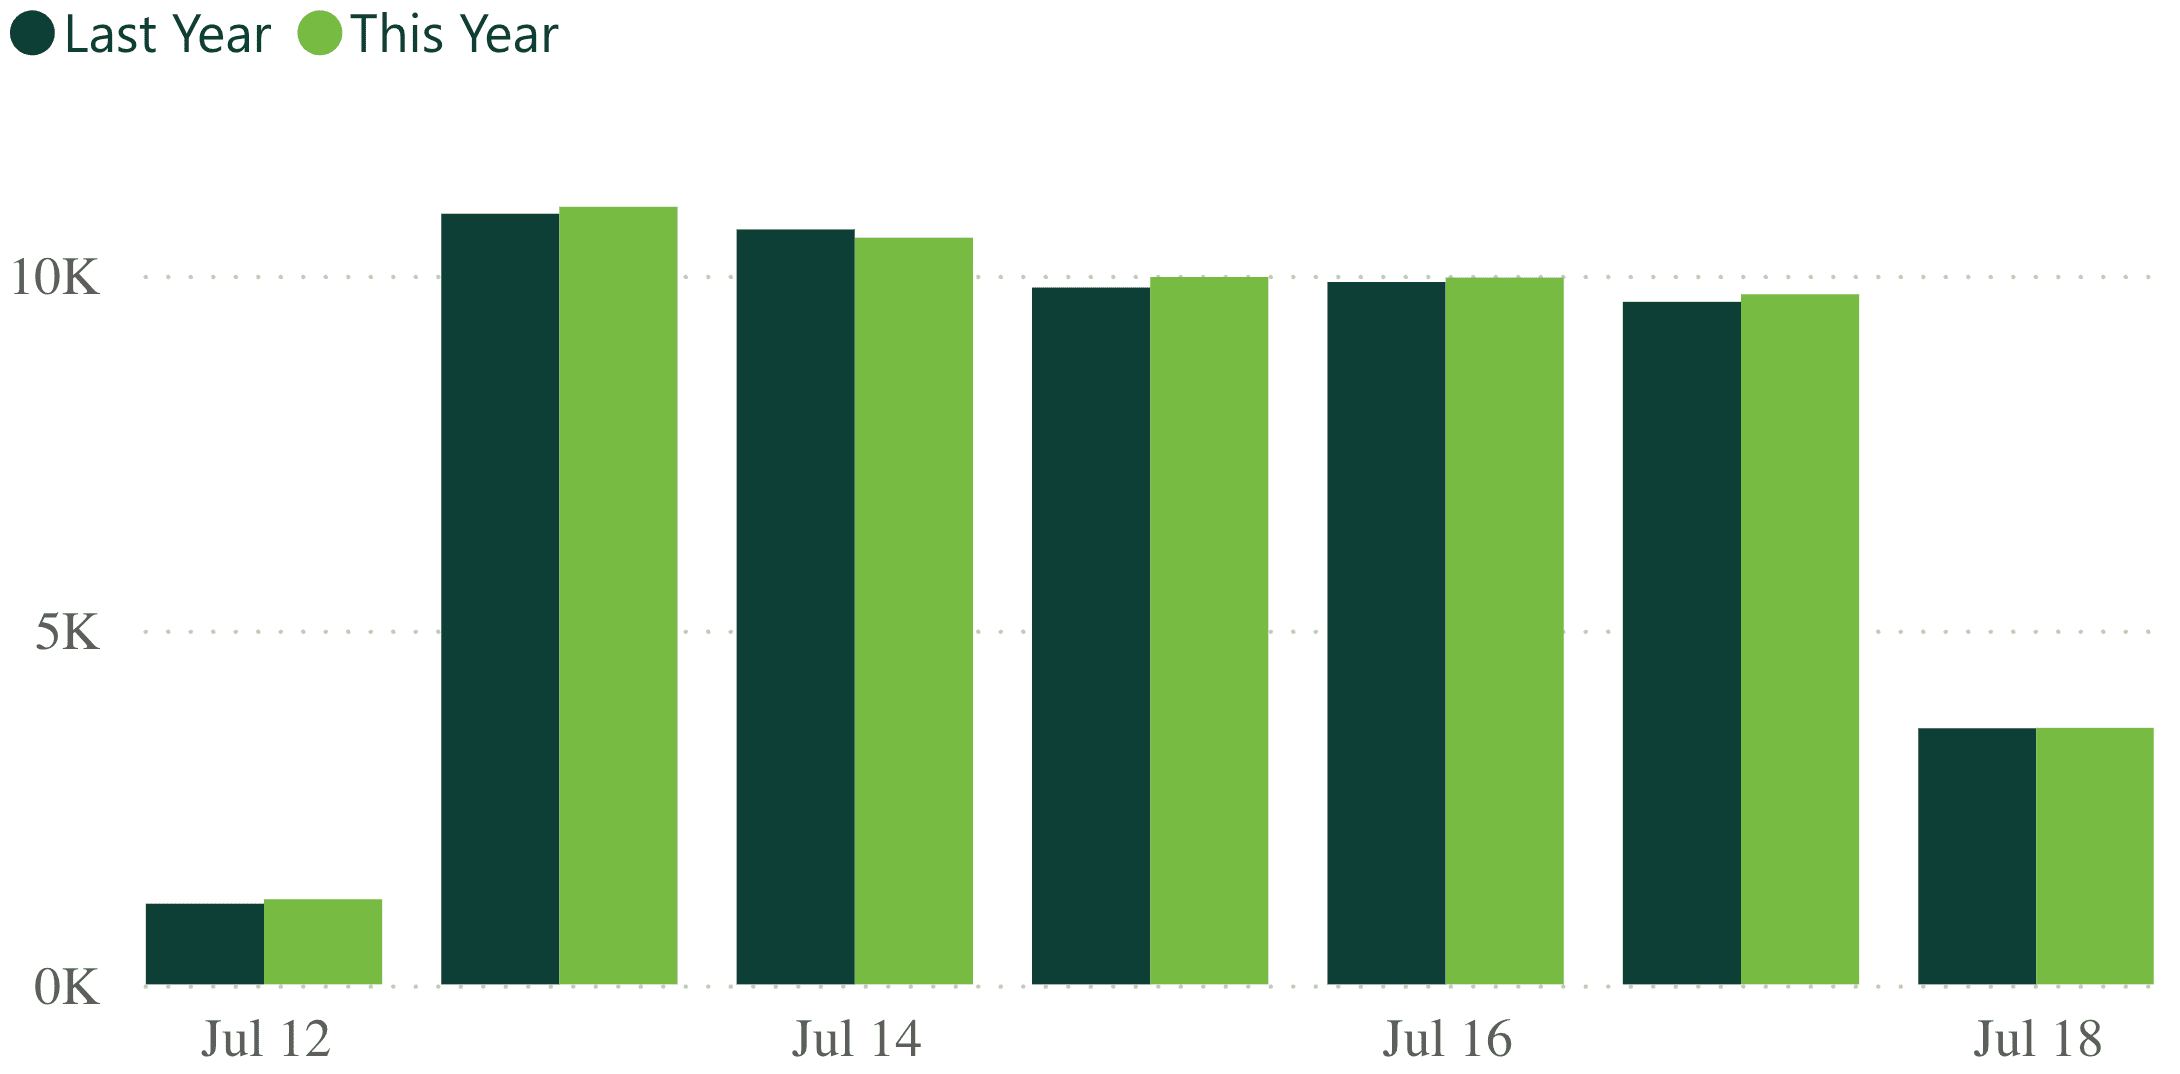
| 0.7% Revenue YoY (Last Week) |
-3.9% Visits YoY (Last Week) |
Industry revenue and visits experienced slight upticks last week. Revenue rose from -0.8% the week prior to 0.7%, and visits increased from -5.2% to -3.9% in the same time frame.
 -9.0% -9.0%Heartworm YoY |
-5.8% Flea/Tick YoY |
 1.6% 1.6%Services YoY |
-2.7% Products YoY |
All categories saw a slight boost last week compared to the previous week. Heartworm was up from -10.6% to -9.0%, flea/tick moved from -6.4% to -5.8%, services increased from 0.3% to 1.6%, and products rose from -4.7% to -2.7%.
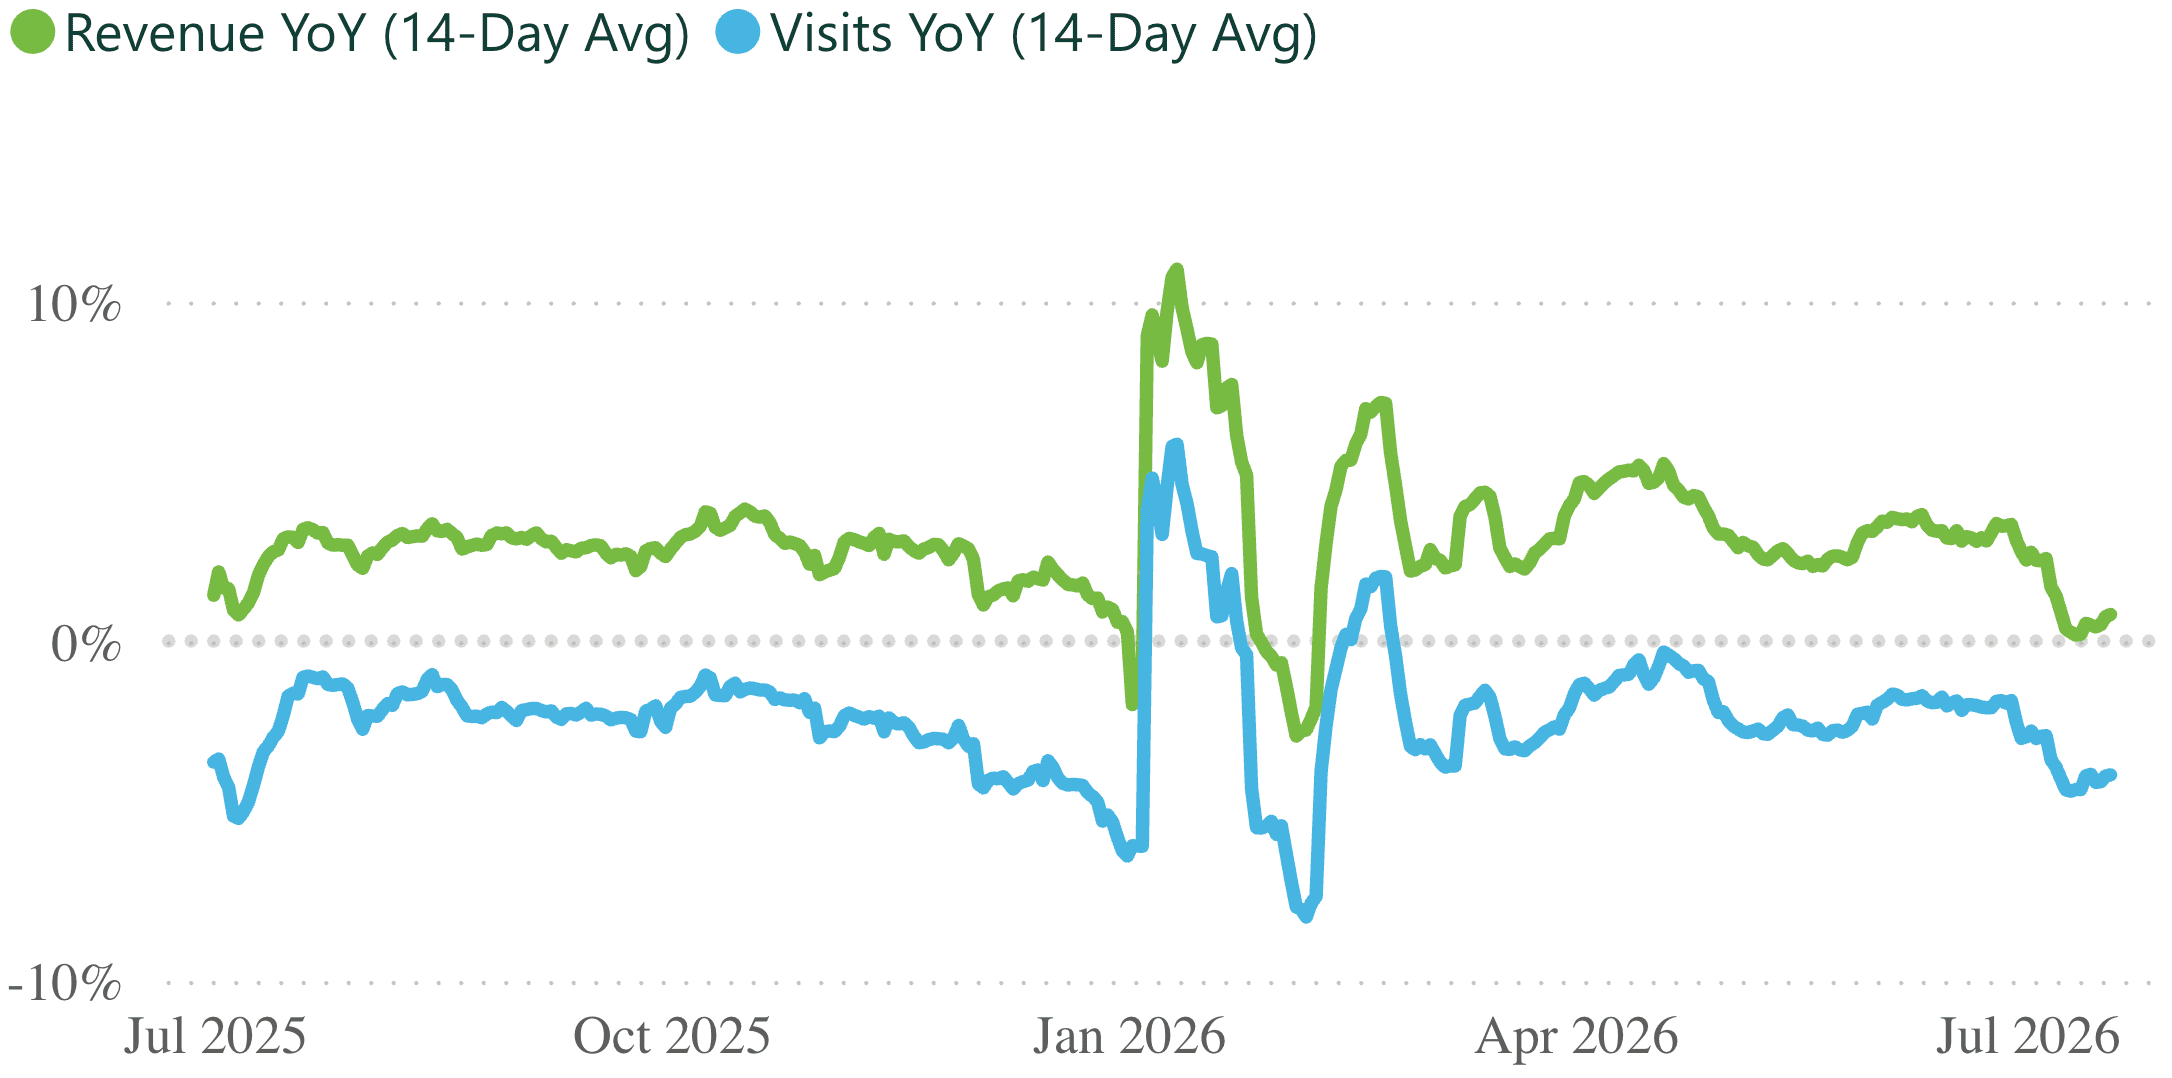
| +3.2% Revenue YoY (Last 12 Months) |
-2.1% Visits YoY (Last 12 Months) |
The rolling 14-day trendline shows a steady rise in revenue and visits after sharply declining in the beginning of July.
| 6,542 Practices |
2.2M Revenue per practice (Last 12 months) |
9.7K Visits per practice (Last 12 months) |
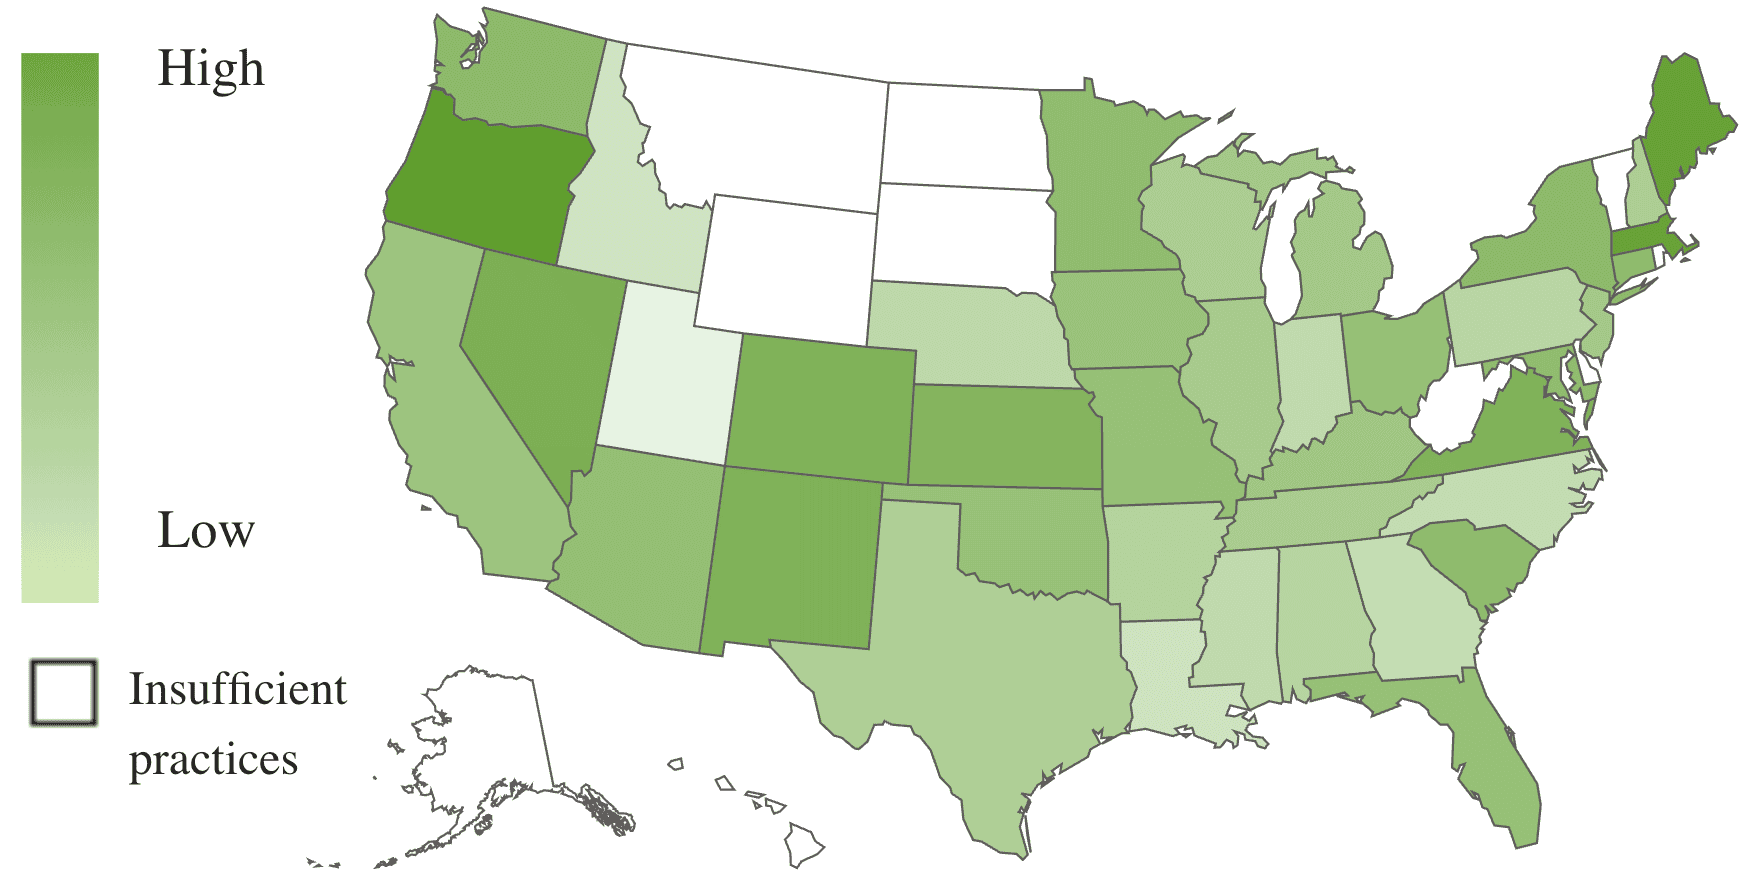
Oregon holds the lead in year-over-year revenue at 6.0%, with Massachusetts and Maine tied for second at 5.7%.
Oregon also leads year-over-year visits at 0.9%, with Nevada trailing and entering the positive at 0.4%, and Minnesota close behind at -0.6%.
*Numbers are subject to change based on data availability and PIMS adjustments.

Need additional stats? You got it.
The Premium Veterinary Industry Tracker lets you drill into revenue categories, visit types, date ranges, states, and more.
| LEARN MORE » |