
Veterinary Industry Summary: August 9-15, 2026

Stats from the Veterinary Industry Tracker powered by Vetsource and AVMA
August 9-15, 2026
The debate over how to address competition for labor and rising care costs continues. Mission Pet Health issued a statement opposing Colorado’s new mid-level Veterinary Professional Associate (VPA) role. Mission expressed concerns around the education provided by VPA programs and the potential extra burden that will be placed on veterinarians by requiring them to oversee and manage VPAs. They propose investing in CVT advancement instead, which they advocated for at last month’s AVMA convention.
In response, the Coalition for the Veterinary Professional Associates (CVPA) issued a statement asserting that VPAs do not compete with CVTs; instead, they offer an advanced career ladder within a defined canine or feline-focused scope.
The CVPA framed VPAs as a necessary complement to technicians to lower costs, ease burnout, and expand access to care. Addressing concerns around education and liability, the CVPA noted that VPA programs require about 1,000 hours of supervised practical training, and VPAs can carry their own professional liability insurance.
They also referenced a study from 2025 which used a model of a typical practice with 3.5 veterinarians. This model projected that adding one full-time VPA would grow annual appointments by almost 75% and increase annual revenue by over $500,000.
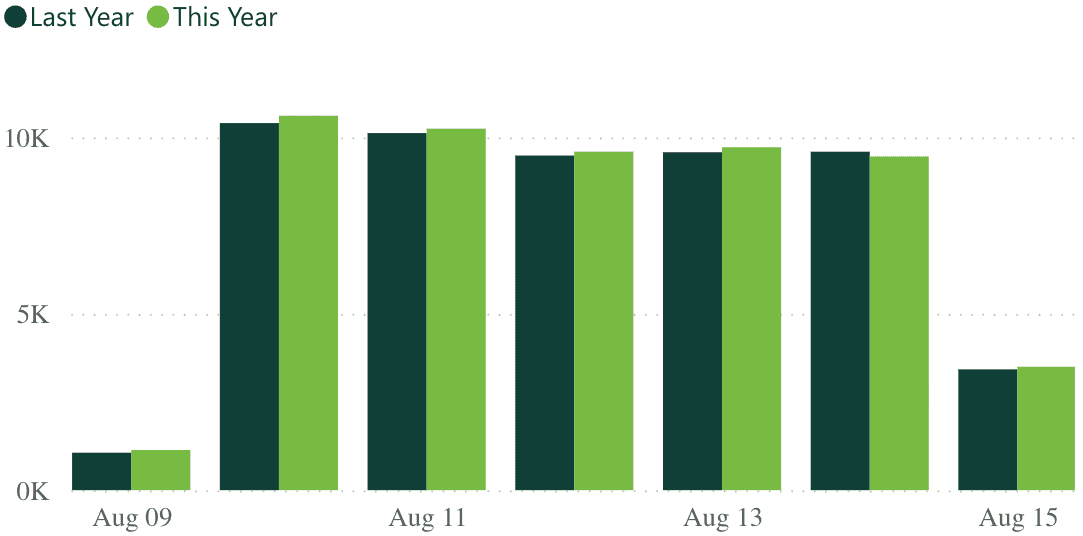
| 1.1% Revenue YoY (Last Week) |
-3.3% Visits YoY (Last Week) |
Industry revenue and visits dropped last week compared to the previous week. Revenue tumbled to 1.1% from 2.4% and visits dipped to -3.3% from -2.3%.
 -9.4% -9.4%Heartworm YoY |
-7.4% Flea/Tick YoY |
 2.3% 2.3%Services YoY |
-3.4% Products YoY |
Parasiticides, services, and products all saw decreases last week compared to the week prior. Heartworm decreased from -7.6% to -9.4%, flea/tick fell from -4.8% to -7.4%, services slightly declined from 3.5% to 2.3%, and products dropped from -1.5% to -3.4%.
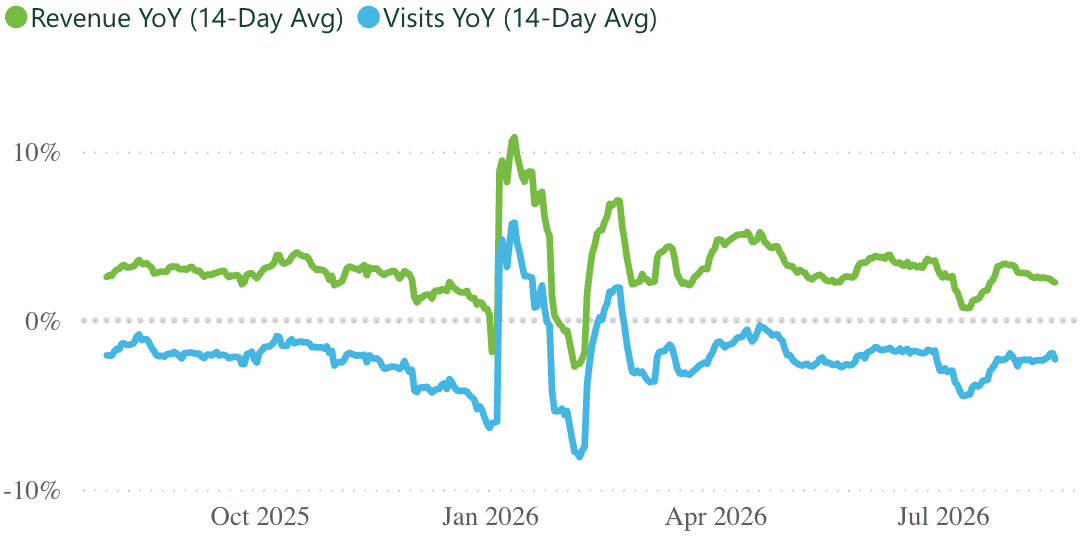
| +3.4% Revenue YoY (Last 12 Months) |
-2.0% Visits YoY (Last 12 Months) |
The rolling 14-day trendline shows revenue and visits becoming more steady after steeply dropping a month ago.
| 6,485 Practices |
2.2M Revenue per practice (Last 12 months) |
9.7K Visits per practice (Last 12 months) |
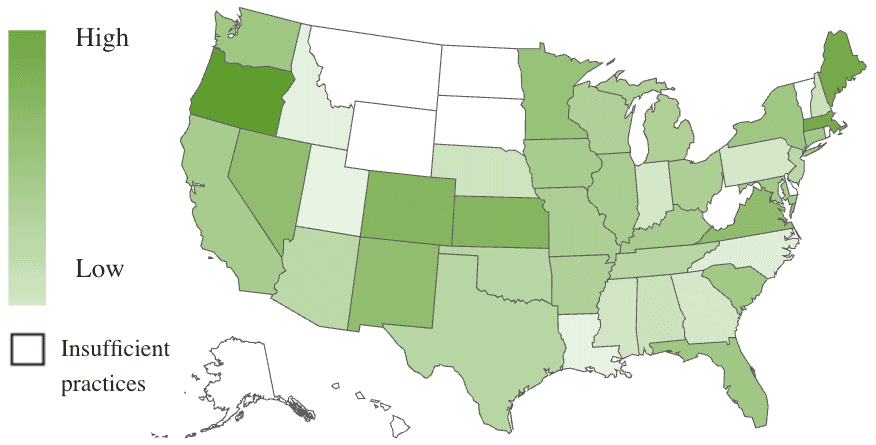
Continuing their lead, Oregon’s year-over-year revenue sits at 6.5%, with Maine and Massachusetts behind at 5.8% and 5.7%, respectively.
Oregon is the only state with positive year-over-year visits at 1.1%.
*Numbers are subject to change based on data availability and PIMS adjustments.

Need additional stats? You got it.
The Premium Veterinary Industry Tracker lets you drill into revenue categories, visit types, date ranges, states, and more.
| LEARN MORE » |