
Veterinary Industry Summary: August 2-8, 2026

Stats from the Veterinary Industry Tracker powered by Vetsource and AVMA
August 2-8, 2026
At the AVMA Convention 2026 last month, industry leaders emphasized that fully leveraging veterinary technicians’ skills is vital for practice sustainability. Citing Gallup data estimating each employee departure costs an employer between 1.5 to 2 times their annual salary, Dr. Markwalder, chief veterinary officer of Mission Pet Health, called it a “financial hemorrhage.”
Rather than looking at veterinary technician training, development, and utilization as expenses, Dr. Markwalder said to consider these things revenue-generating investments. Instead, presenters urged clinics to implement technician-led appointments, establish clearly outlined roles by creating skills-based levels, and conducting regular team checkins.
To bridge the gap between convention excitement and the reality of getting back to the practice, the AVMA provides dedicated online resources and continuing education to help practices maximize their credentialed technicians.
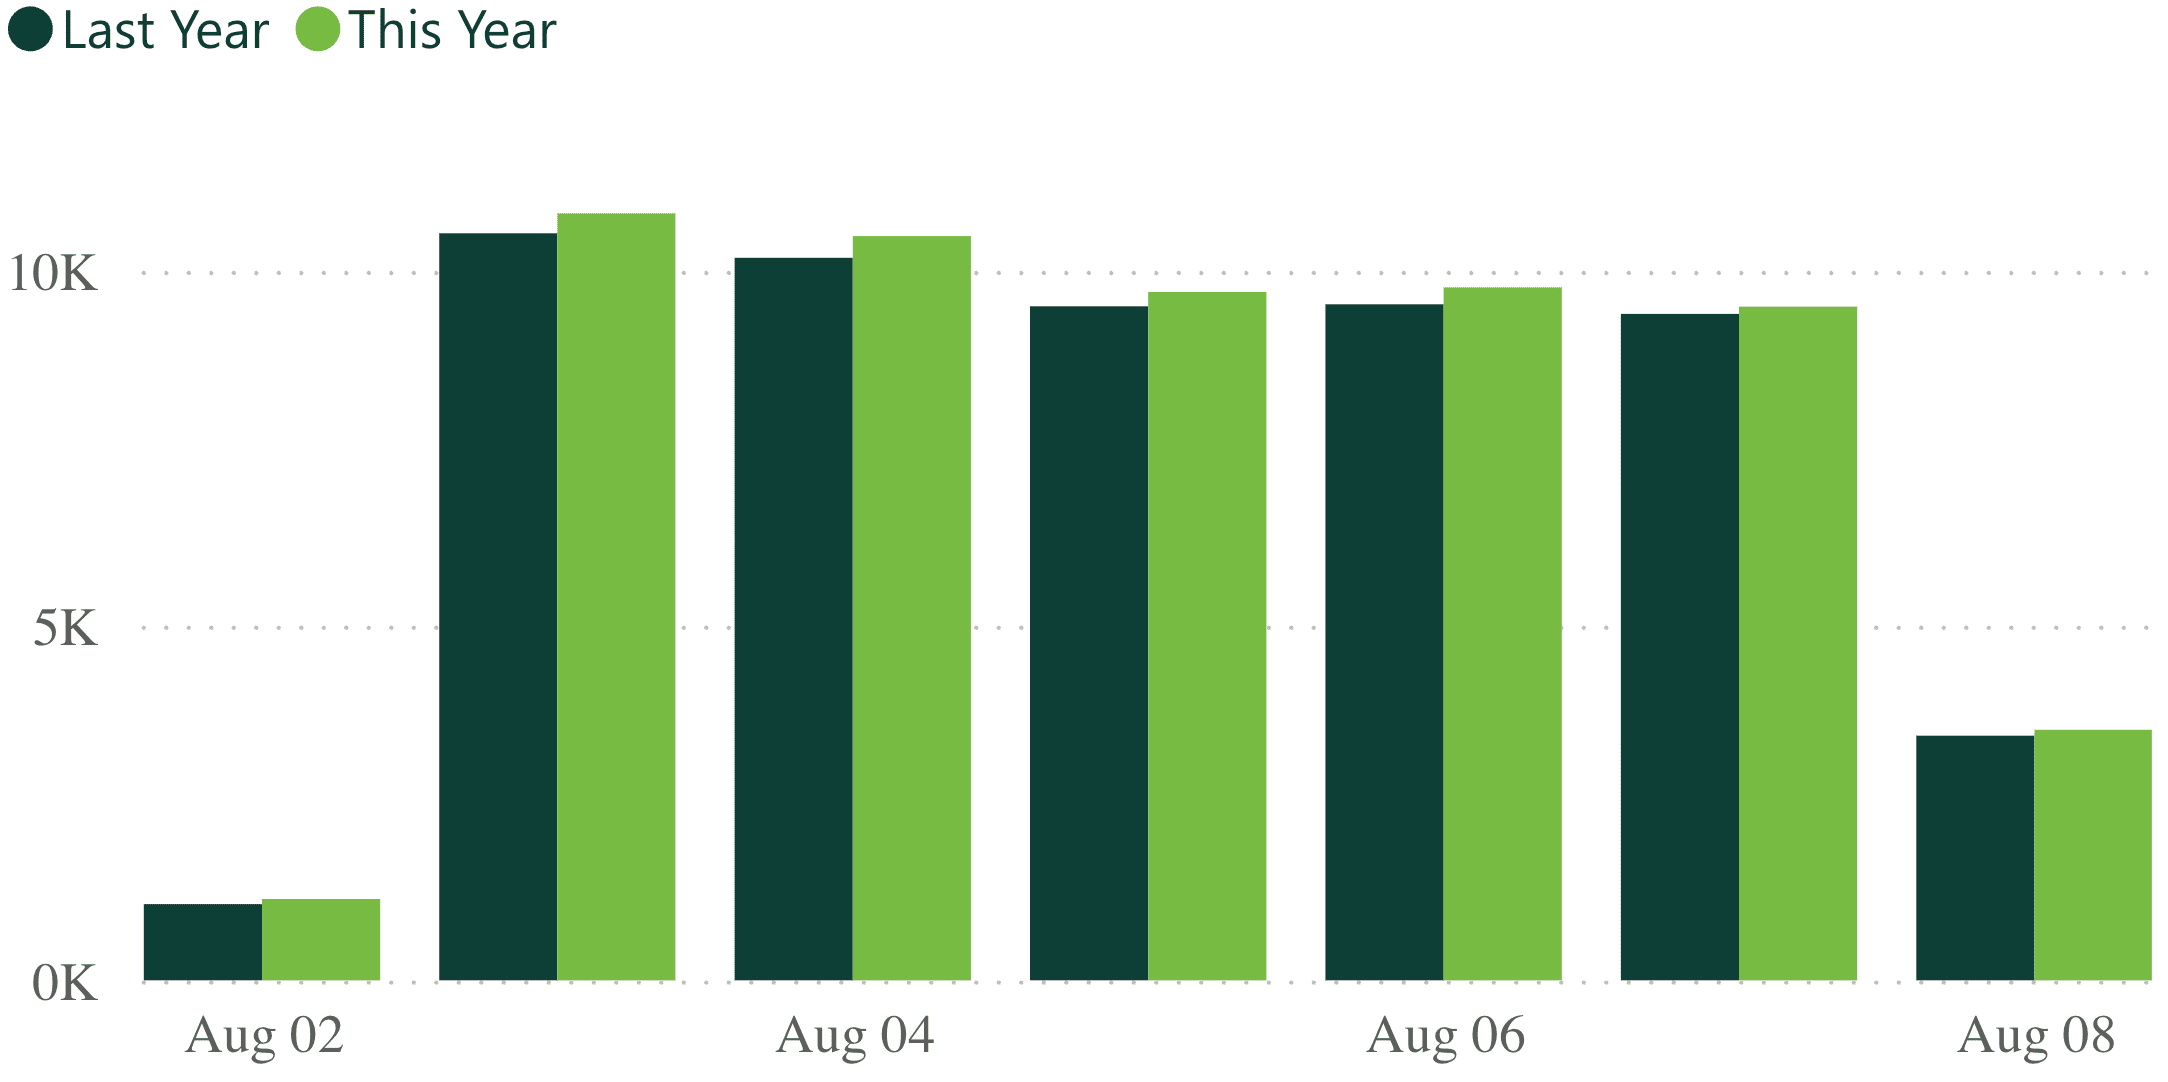
| 2.4% Revenue YoY (Last Week) |
-2.3% Visits YoY (Last Week) |
Industry revenue and visits saw increases last week compared to the week prior. Revenue rose from 1.5% to 2.4%, and visits increased from -3.3% to -2.3%.
 -7.6% -7.6%Heartworm YoY |
-4.8% Flea/Tick YoY |
 3.5% 3.5%Services YoY |
-1.5% Products YoY |
Parasiticides, services, and products all received boosts last week compared to the previous week. Heartworm climbed from -11.5% to -7.6%, flea/tick grew from -8.1% to -4.8%, services saw a small increase from 2.8% to 3.5%, and products increased from -3.3% to -1.5%
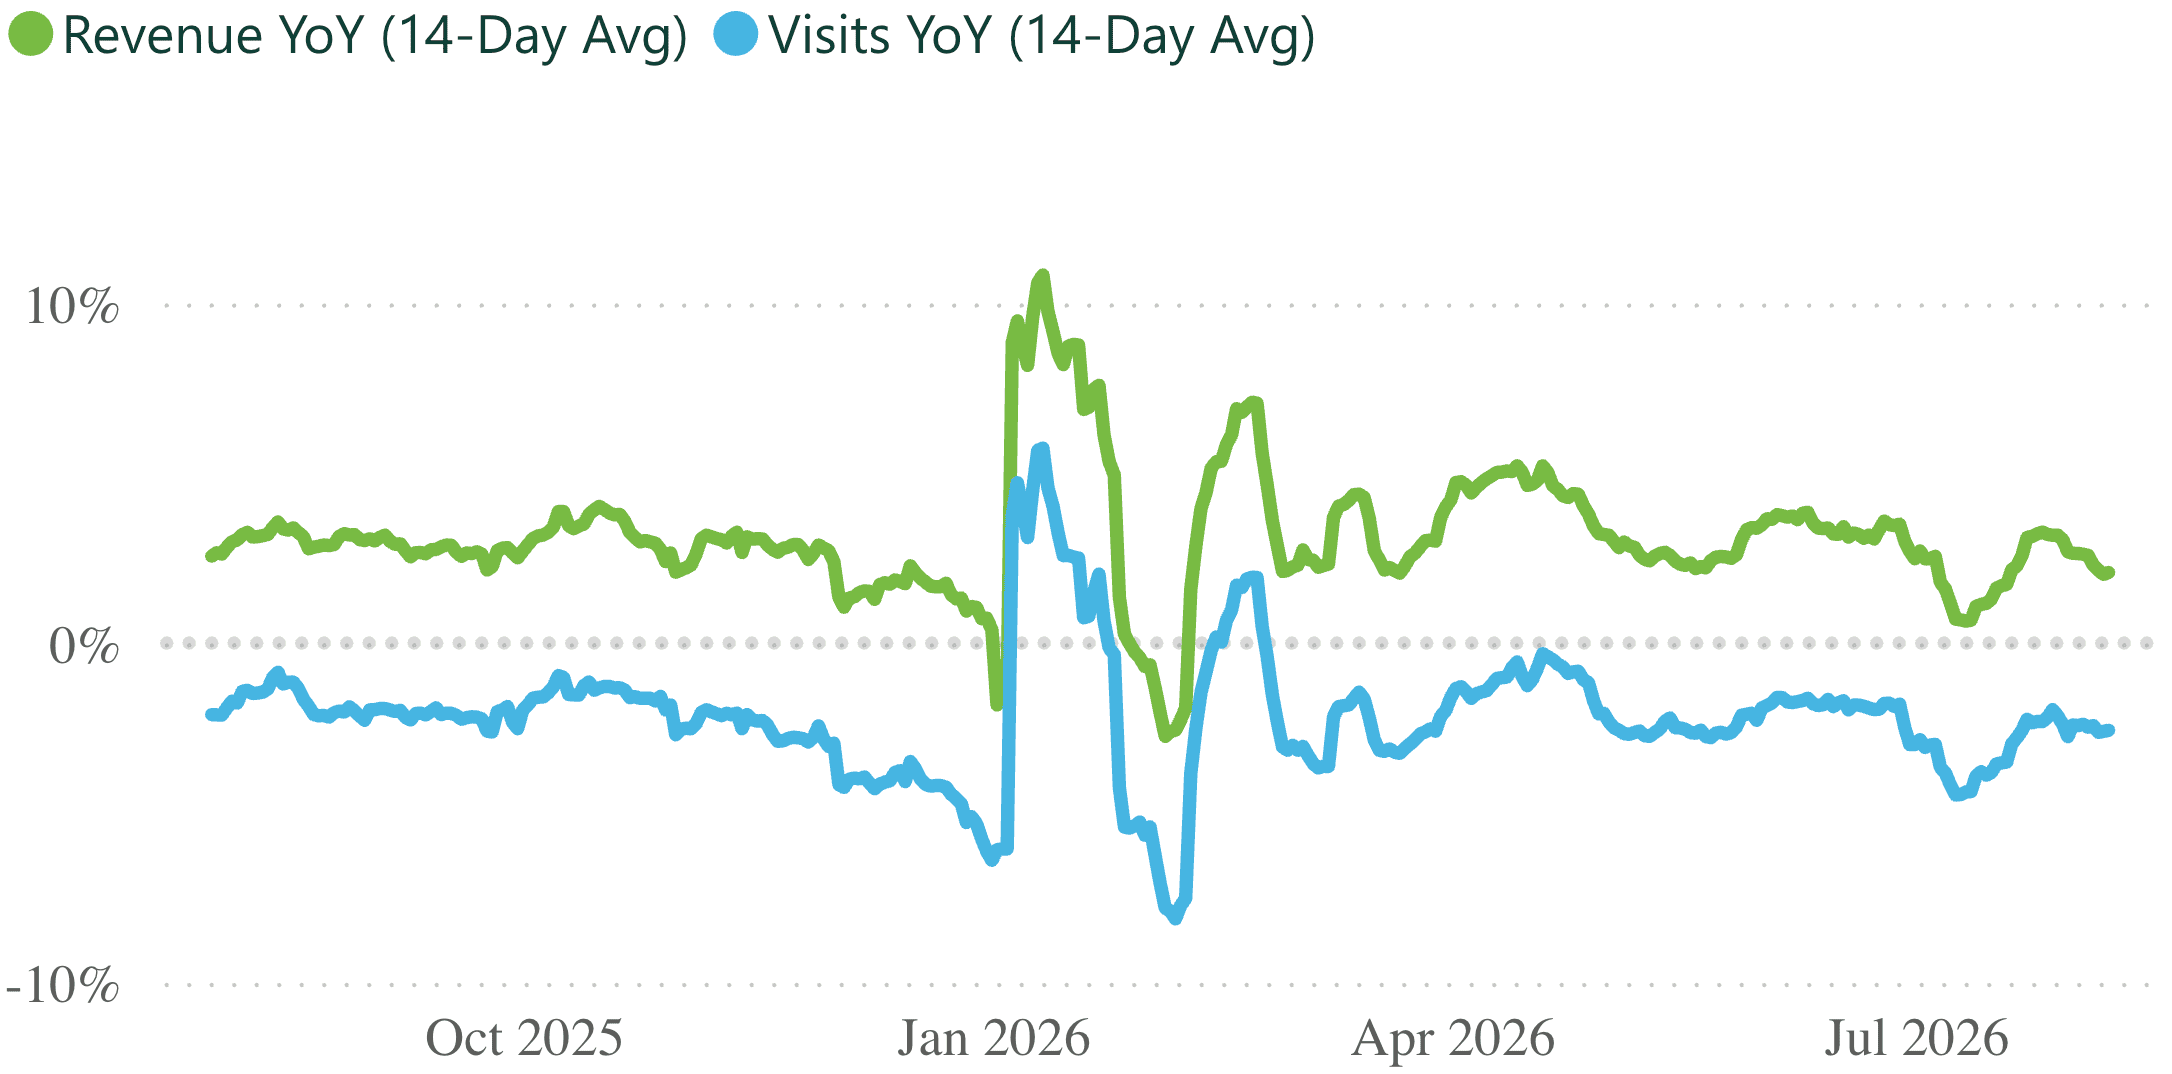
| +3.3% Revenue YoY (Last 12 Months) |
-2.1% Visits YoY (Last 12 Months) |
The rolling 14-day trendline shows revenue and visits steadily declining since the end of July.
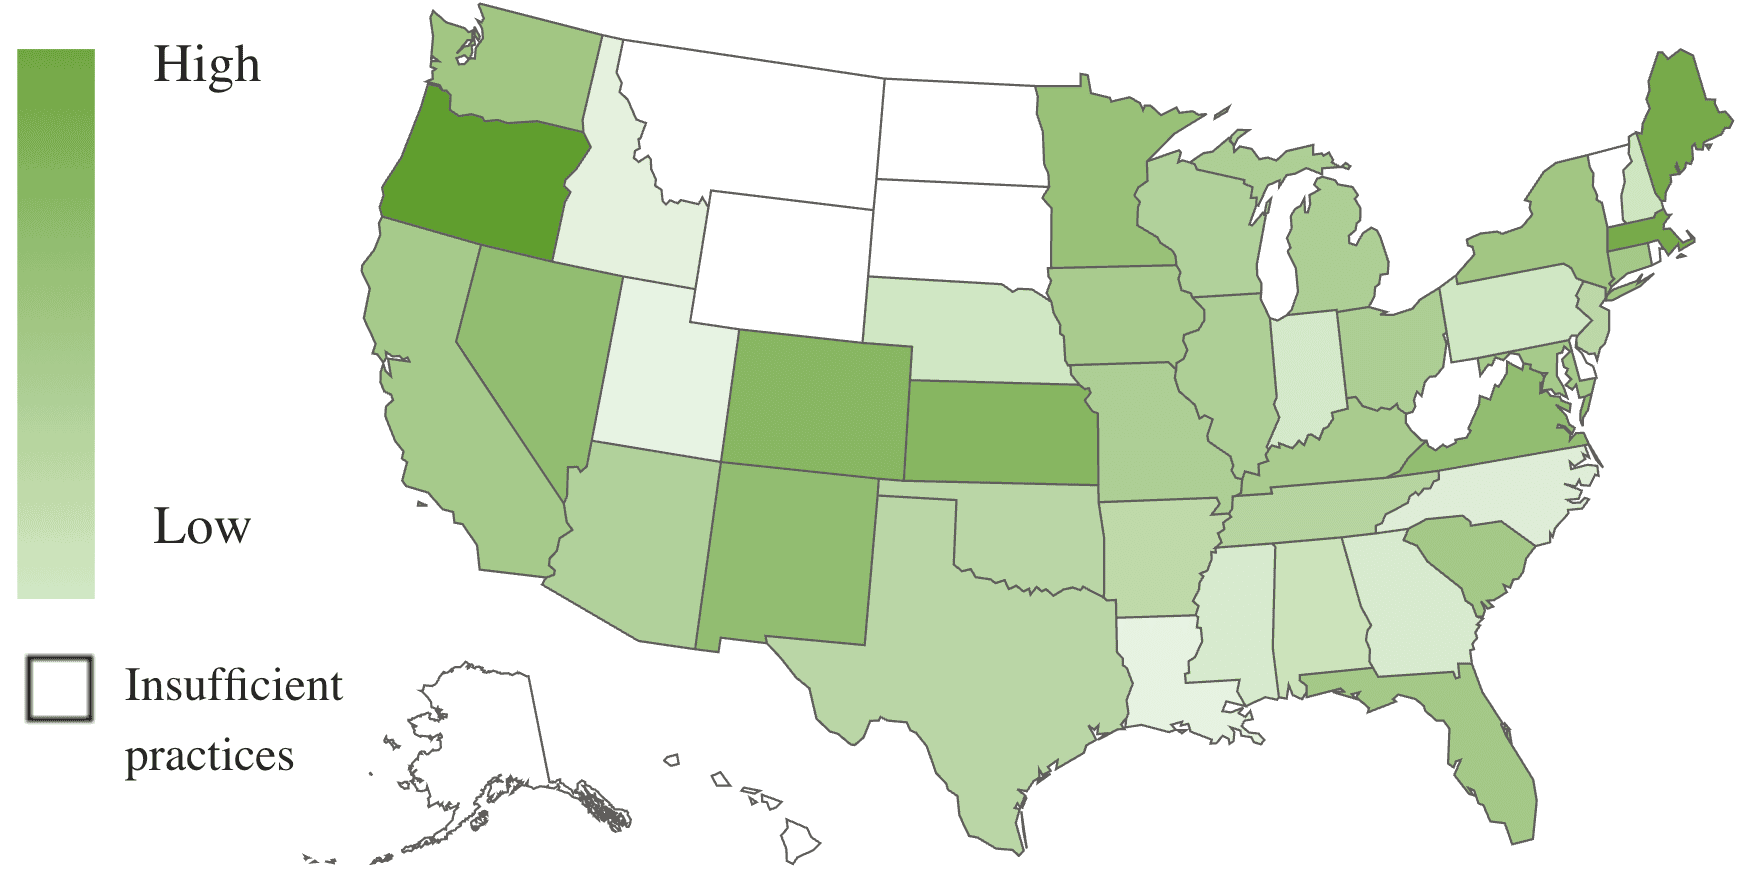
| 6,474 Practices |
2.2M Revenue per practice (Last 12 months) |
9.7K Visits per practice (Last 12 months) |
Just like last week, Oregon continues to lead year-over-year revenue at 6.5%, with Maine in second at 5.7%, and Massachusetts trailing at 5.6%.
Oregon also leads year-over-year visits at 1.1%. Minnesota and Kansas are close behind, with both sitting at -0.5%.
*Numbers are subject to change based on data availability and PIMS adjustments.

Need additional stats? You got it.
The Premium Veterinary Industry Tracker lets you drill into revenue categories, visit types, date ranges, states, and more.
| LEARN MORE » |