Stats from the Veterinary Industry Tracker powered by Vetsource and AVMA
September 6 – 12, 2026
A federal judge has dismissed an antitrust lawsuit(opens in new tab) [1] brought by Lincoln Memorial University (LMU) against the American Veterinary Medical Association (AVMA). Judge Thomas Varlan ruled that LMU’s claims of harm were too speculative at this point, and dismissed the case without prejudice meaning LMU could file again in the future.
LMU, home to the nation’s largest veterinary school by enrollment, claimed that the AVMA, through the AVMA COE (Council on Education), engaged in “anticompetitive accreditation practices” and expressed issues with accreditation requirements regarding research.
The AVMA stated, “For decades, the COE has adopted clearly defined standards for veterinary school accreditation, designed to ensure that graduates of accredited programs are properly trained to provide quality care for their animal patients. Following the dismissal of LMU’s case against the AVMA, LMU will continue to have the opportunity to demonstrate that it meets the COE’s standards.”
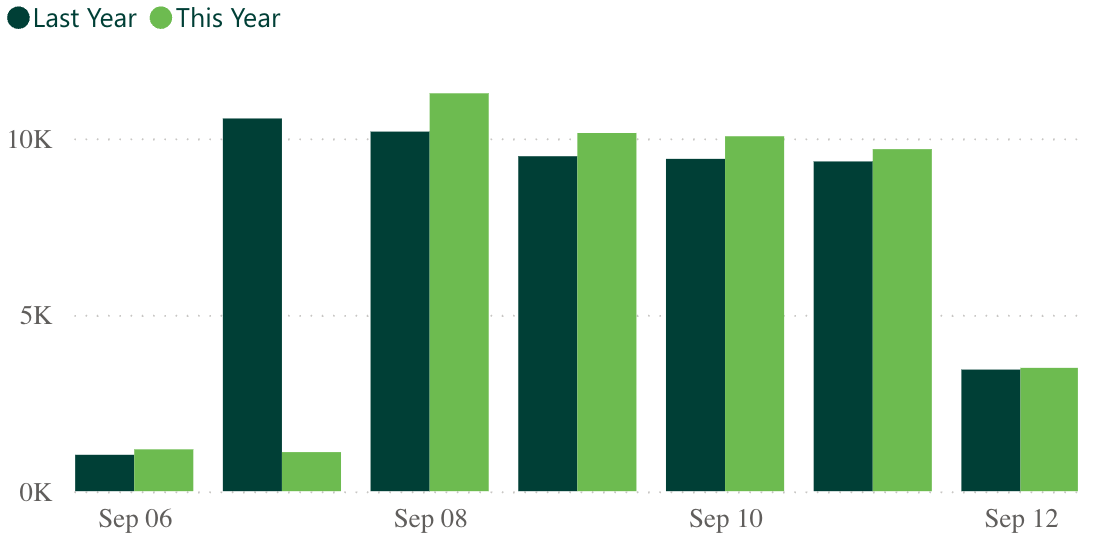
| -12.2% Revenue YoY (Last Week) |
-15.3% Visits YoY (Last Week) |
Industry revenue and visits tumbled compared to the week prior, due to last year’s Labor Day taking place on Sept. 1, much earlier than most years. Revenue dropped from 17.1% to -12.2%, and visits declined from 13.5% to -15.3%.
 -21.8% -21.8%Heartworm YoY |
-19.2% Flea/Tick YoY |
| –11.5% Services YoY |
-14.6% Products YoY |
Parasiticides, services, and products also all plummeted compared to the week prior. Heartworm declined from 6.2% to -21.8%, flea/tick fell from 8.5% to -19.2%, services fell from 18.3% to -11.5%, and products decreased from 12.9% to -14.6%.
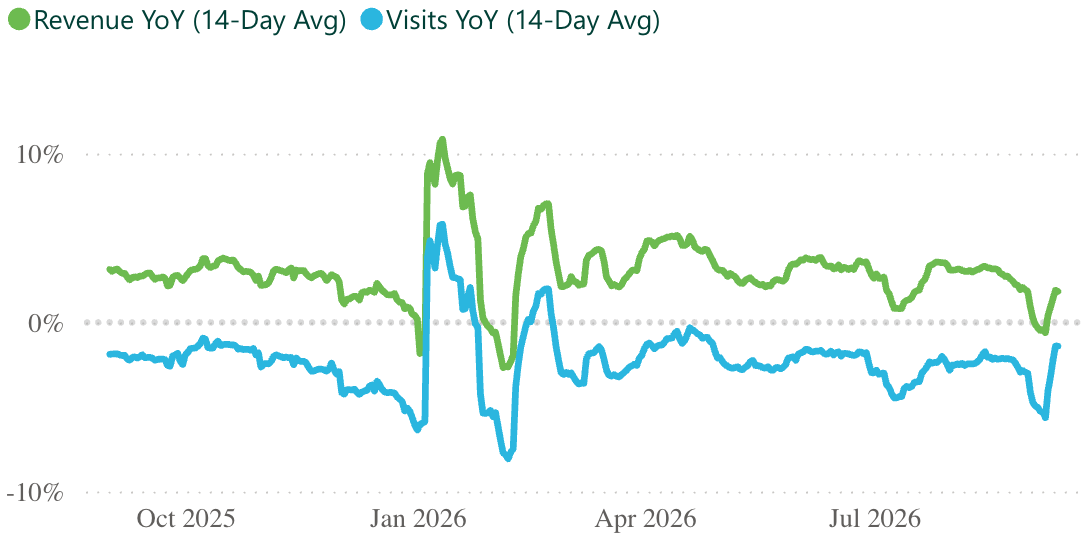
| +3.7% Revenue YoY (Last 12 Months) |
-1.7% Visits YoY (Last 12 Months) |
The rolling 14-day trendline shows revenue and visits sharply increasing as we enter the middle of the month.
| 6,430 Practices |
2.2M Revenue per practice (Last 12 months) |
9.7K Visits per practice (Last 12 months) |
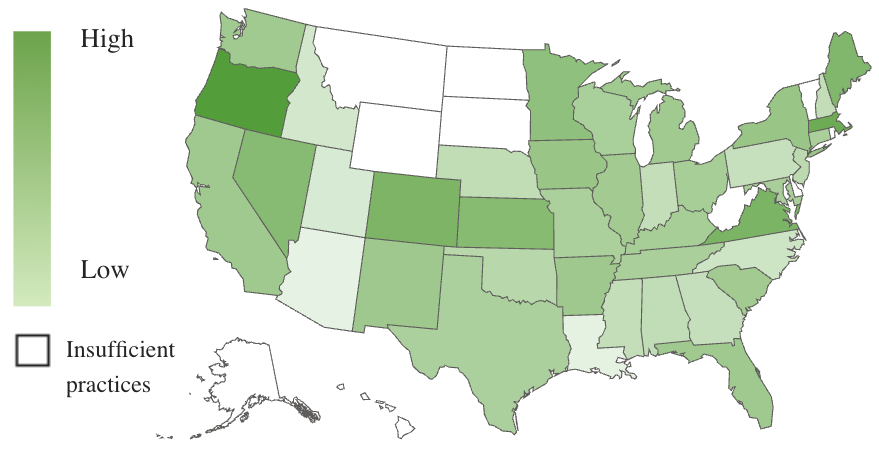
Similar to the prior week, Oregon leads revenue growth at 7.3%, with Massachusetts in second at 6.2%. Virginia has taken third place at 5.6%.
Oregon once again leads visits at 1.7%, and Iowa has also entered the positive at 0.1%.
*Numbers are subject to change based on data availability and PIMS adjustments.

Need additional stats? You got it.
The Premium Veterinary Industry Tracker lets you drill into revenue categories, visit types, date ranges, states, and more.
| LEARN MORE »(opens in new tab) [2] |