Stats from the Veterinary Industry Tracker powered by Vetsource and AVMA
September 27 – October 3, 2026
AI adoption more than doubled in the past few years, according to a new report(opens in new tab) [1] from Digital and AAHA.
Surveying more than 1700 veterinary professionals, the report notes the rapid shift in sentiment and adoption from a similar 2024 report, pointing to the need to look beyond mere adoption and delve deeper into the industry’s overall AI maturity.
Key findings include:
- A majority of practices feel ready for AI, but nearly half have no plan and almost a third have no AI governance in place.
- Clinical documentation is the most common AI tool used at 71.2%, with diagnostic tools lagging significantly behind.
- When it comes to client communications, 61.1% send rule-based reminders, but only 11% get tailored next-step recommendations for each patient.
- The most AI-mature practices see 6x the positive business outcomes compared to the least AI-mature practices.
The report uses a maturity model framework adapted from the Healthcare AI Governance Readiness Assessment (HAIRA), a peer-reviewed framework from human healthcare and includes a discussion and recommendations from Adam Wysocki, founder of VetSoftwareHub.
Download the full report(opens in new tab) [1]
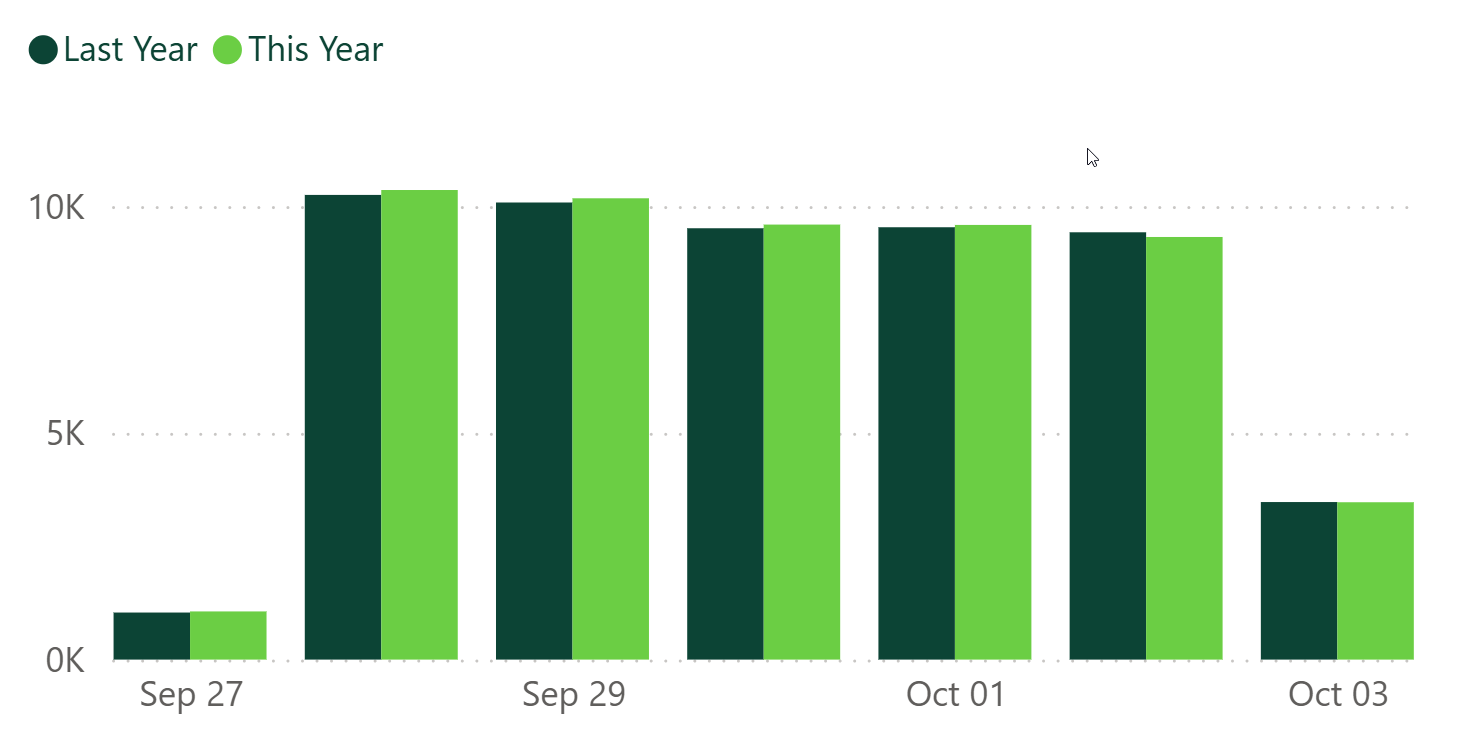
| .5% Revenue YoY (Last Week) |
-3.8% Visits YoY (Last Week) |
Industry revenue and visits fell again last week compared to the prior week, with revenue dropping from 1.7% to .5%, and visits decreasing from -2.6% to -3.8%
 -12.9% -12.9%Heartworm YoY |
-13.2% Flea/Tick YoY |
 2.0% 2.0%Services YoY |
-5.2% Products YoY |
Parasiticides, services, and products, also dropped again compared to the week prior. Heartworm dipped from -8.5% to -12.9%, flea/tick fell from -8.3% to -13.2%, services declined from 3.0% to 2.0%, and products decreased from -3.1% to -5.2%.
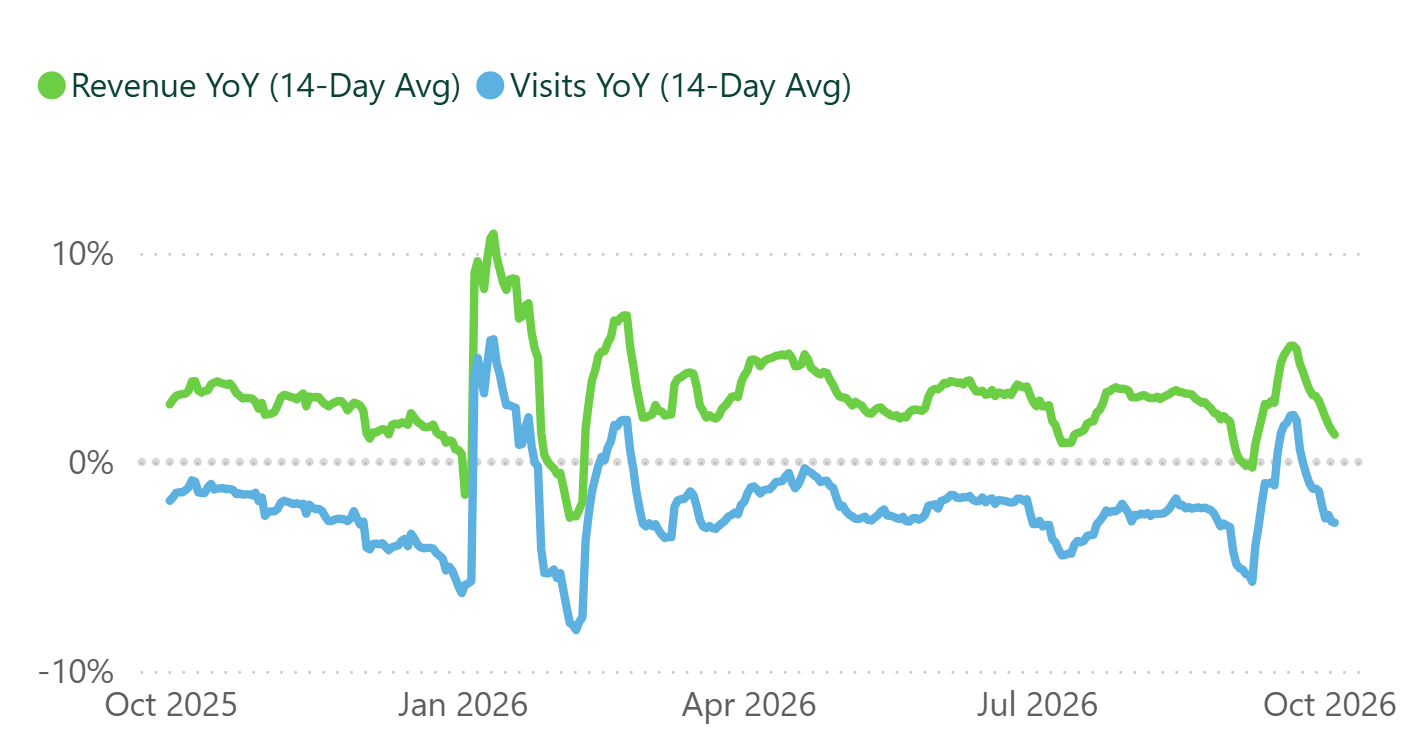
| +3.4% Revenue YoY (Last 12 Months) |
-2.1% Visits YoY (Last 12 Months) |
The 12-month trends show revenue and visits continuing downward.
| 6,388 Practices |
2.2M Revenue per practice (Last 12 months) |
9.6K Visits per practice (Last 12 months) |
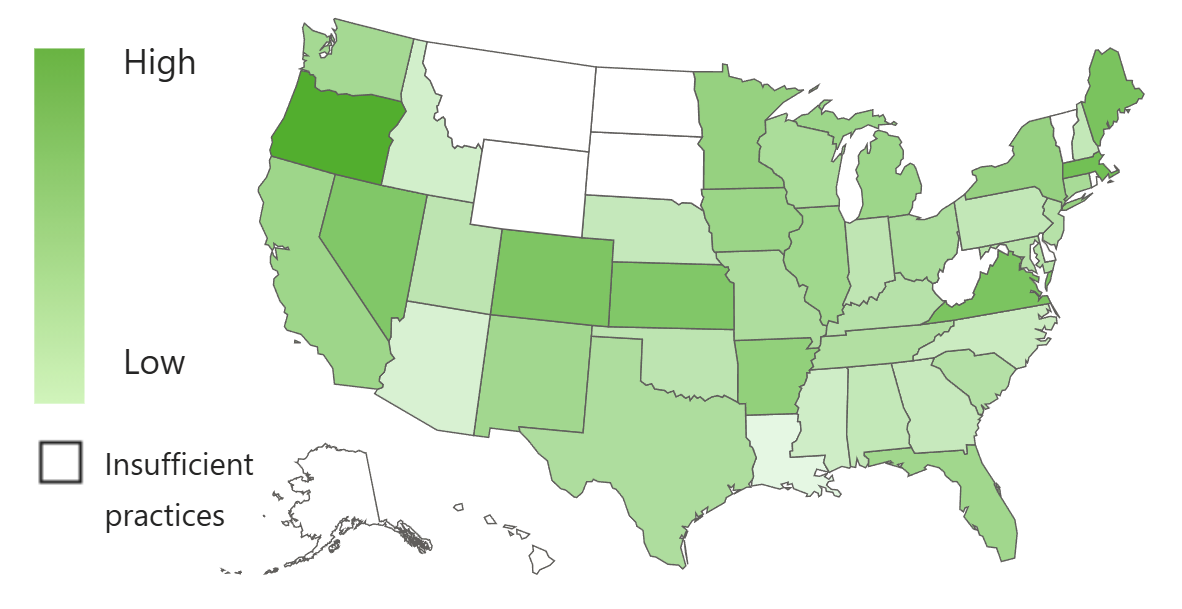
Oregon stays on top with revenue growth at 7.2%, with Massachusetts following at 5.8%. Maine and Virginia follow close behind at 5.5% and 5.4% respectively.
Oregon is also the only state with positive YoY visits, at 1.6%.
*Numbers are subject to change based on data availability and PIMS adjustments.

Need additional stats? You got it.
The Premium Veterinary Industry Tracker lets you drill into revenue categories, visit types, date ranges, states, and more.
| LEARN MORE »(opens in new tab) [2] |