Stats from the Veterinary Industry Tracker powered by Vetsource and AVMA
September 13 – 19, 2026
Last week, IDEXX announced their acquisition of CoVet(opens in new tab) [1], a provider of AI-based ambient listening and clinical workflow software for veterinary practices.
The software automates the capture and organization of patient data throughout the care journey to reduce documentation time for veterinary teams. IDEXX plans to integrate CoVet into its software ecosystem while supporting non-IDEXX practice management systems.
Highlighting the need for better data management as practices face growing complexity, Mike Erickson, IDEXX president and CEO, stated, “CoVet brings leading workflow intelligence capabilities that complement our diagnostic and software ecosystem. Together, we can help veterinary professionals work more efficiently and unlock greater value from information generated throughout the clinical workflow to support expanded patient care.”
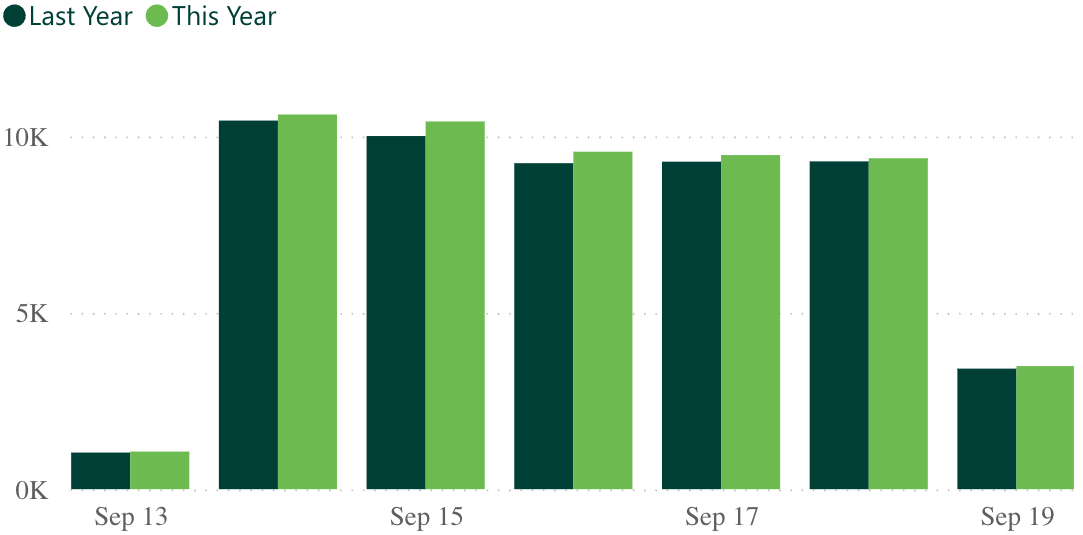
| -2.4% Revenue YoY (Last Week) |
-1.5% Visits YoY (Last Week) |
Industry revenue and visits grew significantly last week compared to the prior week due to the Labor Day holiday. Revenue jumped from -12.2% to 2.4%, and visits increased from -15.3% to -1.5%.
 -6.6% -6.6%Heartworm YoY |
-4.8% Flea/Tick YoY |
 3.4% 3.4%Services YoY |
-1.3% Products YoY |
Parasiticides, services, and products also all rose compared to the week prior. Heartworm increased from -21.8% to -6.6%, flea/tick climbed from -19.2% to -4.8%, services jumped from -11.5% to 3.4%, and products increased from -14.6% to -1.3%.
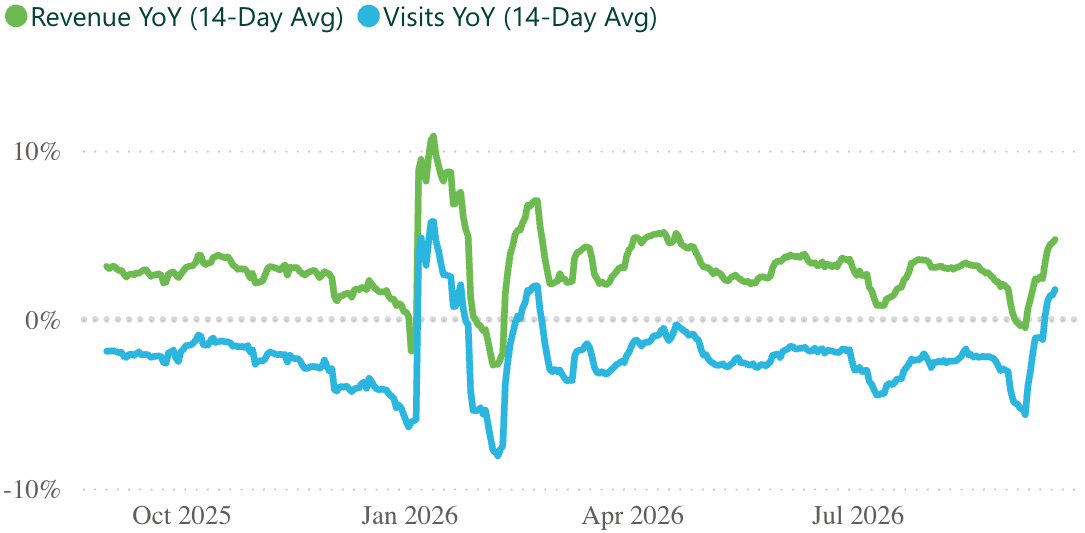
| +3.7% Revenue YoY (Last 12 Months) |
-1.7% Visits YoY (Last 12 Months) |
The rolling 14-day trendline shows a sharp rise in revenue and visits since the beginning of September.
| 6,433 Practices |
2.2M Revenue per practice (Last 12 months) |
9.7K Visits per practice (Last 12 months) |
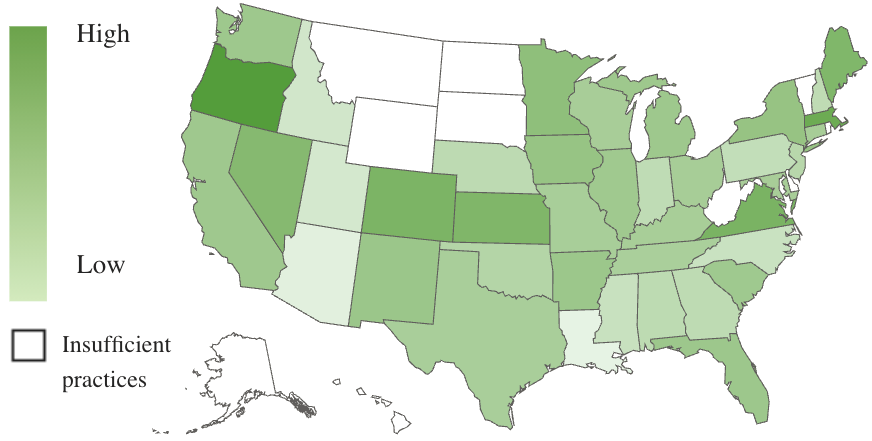
Oregon and Massachusetts maintain their lead in revenue growth at 7.3% and 6.2%, respectively. Virginia and Colorado are tied for third place at 5.6%.
Oregon and Iowa are the only states with positive visits, with Oregon at 1.7% and Iowa at 0.1%.
*Numbers are subject to change based on data availability and PIMS adjustments.

Need additional stats? You got it.
The Premium Veterinary Industry Tracker lets you drill into revenue categories, visit types, date ranges, states, and more.
| LEARN MORE »(opens in new tab) [2] |