Stats from the Veterinary Industry Tracker powered by Vetsource and AVMA
October 11 – 17, 2026
The surge in new pets in the early years of the pandemic resulted in speculation about an increase in aging patients for veterinary practices. But the data since then shows a downward trend in new patient acquisitions for all age groups.
A new white paper from Vetsource, “Where are the pandemic puppies and kittens?(opens in new tab) [1]” digs into the numbers behind pandemic pets and what they mean for veterinary practices.
Key findings from the report include:
- New puppy/kitten patients peaked in 2021, as did patients in the 1-7 age group, while patients 8 years and older peaked earlier in 2020.
- As of May 2026, year-over-year new puppy/kitten patient numbers have declined by nearly 10%.
- Growth for the 8+ age group has remained relatively stable, hovering near 0%.
The report concludes with recommendations for practices to proactively safeguard their business going forward.
| 1.3% Revenue YoY (Last Week) |
-3.0% Visits YoY (Last Week) |
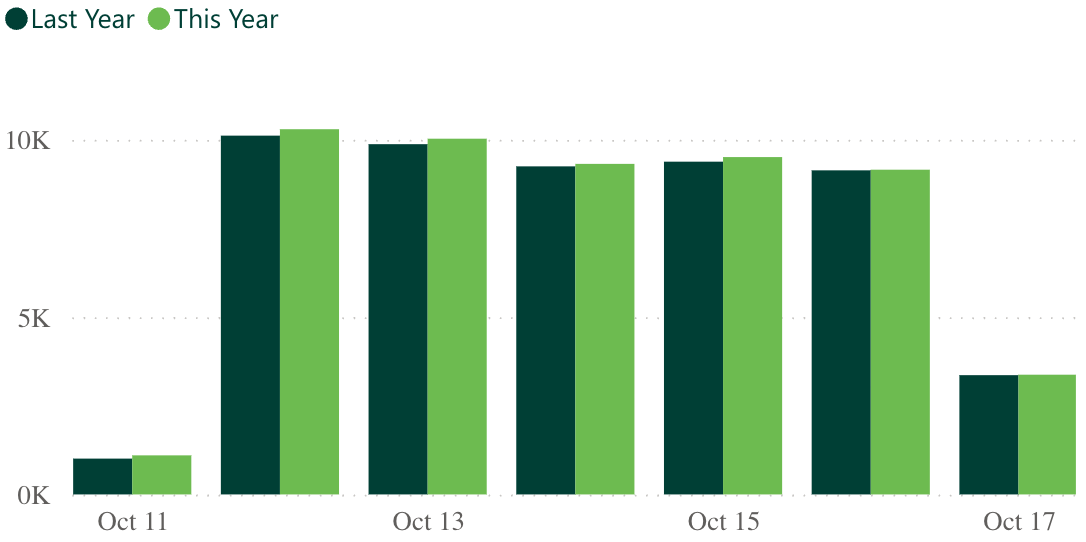
Industry revenue and visits saw a minor boost last week compared to the prior week, with revenue increasing from 0.0% to 1.3%, and visits slightly rising from -3.2% to -3.0%.
 -10.0% Heartworm YoY |
-9.8% Flea/Tick YoY |
 2.6% Services YoY |
-3.8% Products YoY |
Parasiticides and products fell last week compared to the week prior, with heartworm dipping from -8.7% to -10.0%, and flea/tick decreasing from -8.6% to -9.8%. Products slightly fell from -3.5% to -3.8%.
Services increased from 0.9% to 2.6% in the same time period.
| +3.4% Revenue YoY (Last 12 Months) |
-2.0% Visits YoY (Last 12 Months) |
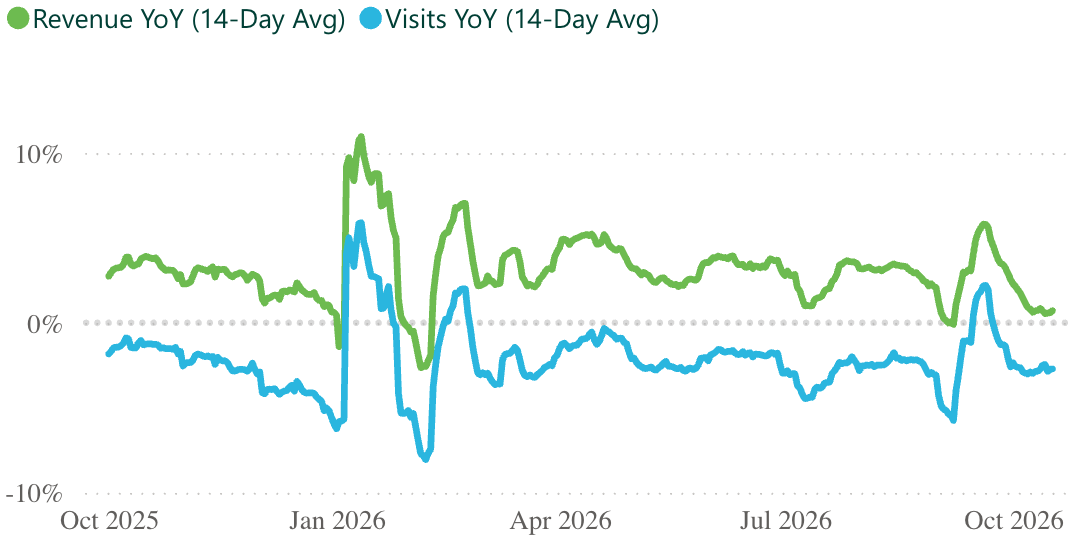
The 12-month trends show revenue and visits stabilizing as we enter the end of October.
| 6,372 Practices |
2.2M Revenue per practice (Last 12 months) |
9.6K Visits per practice (Last 12 months) |
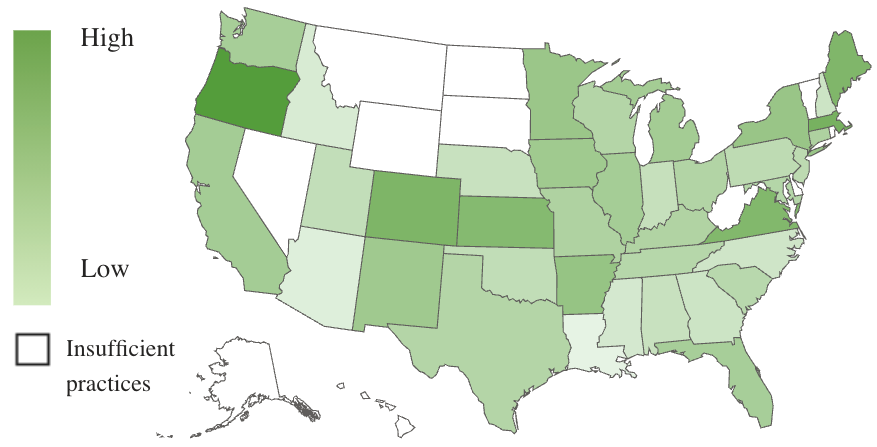
Oregon still leads revenue growth at 7.3%, Massachusetts and Maine following at 5.8% and 5.4%, respectively.
Once again Oregon is the only state with positive YoY visits, at 1.8%.
*Numbers are subject to change based on data availability and PIMS adjustments.

Need additional stats? You got it.
The Premium Veterinary Industry Tracker lets you drill into revenue categories, visit types, date ranges, states, and more.
| LEARN MORE »(opens in new tab) [2] |