Stats from the Veterinary Industry Tracker powered by Vetsource and AVMA
November 1 – 7, 2026
Elanco just released a survey of 2,018 U.S. consumers(opens in new tab) [1] showing pet spending remains a priority despite inflation. 93% of pet owners maintained or increased pet spending over the last three months, and 93% plan to do the same in 2027. Only 7% would cut pet health costs under financial pressure, compared to 54% for dining out and entertainment.
The results also show that 63% of pet owners consider their pet’s well being more important than their own. Pet medication purchases have shifted, with 38% of pet owners moving outside the clinic in the past couple years.
However, even with more shopping options, a vet’s recommendation is the top reason pet owners switch medications, with discounts influencing only 3%. Elanco executive Bobby Modi noted, “Our October data reinforces what we see every day across the marketplace: pet health is not a discretionary luxury, but a deeply emotional, non-negotiable commitment.”
Check out the Veterinary Industry Tracker(opens in new tab) [2] for daily stats.
| 1.8% Revenue YoY (Last Week) |
-1.9% Visits YoY (Last Week) |
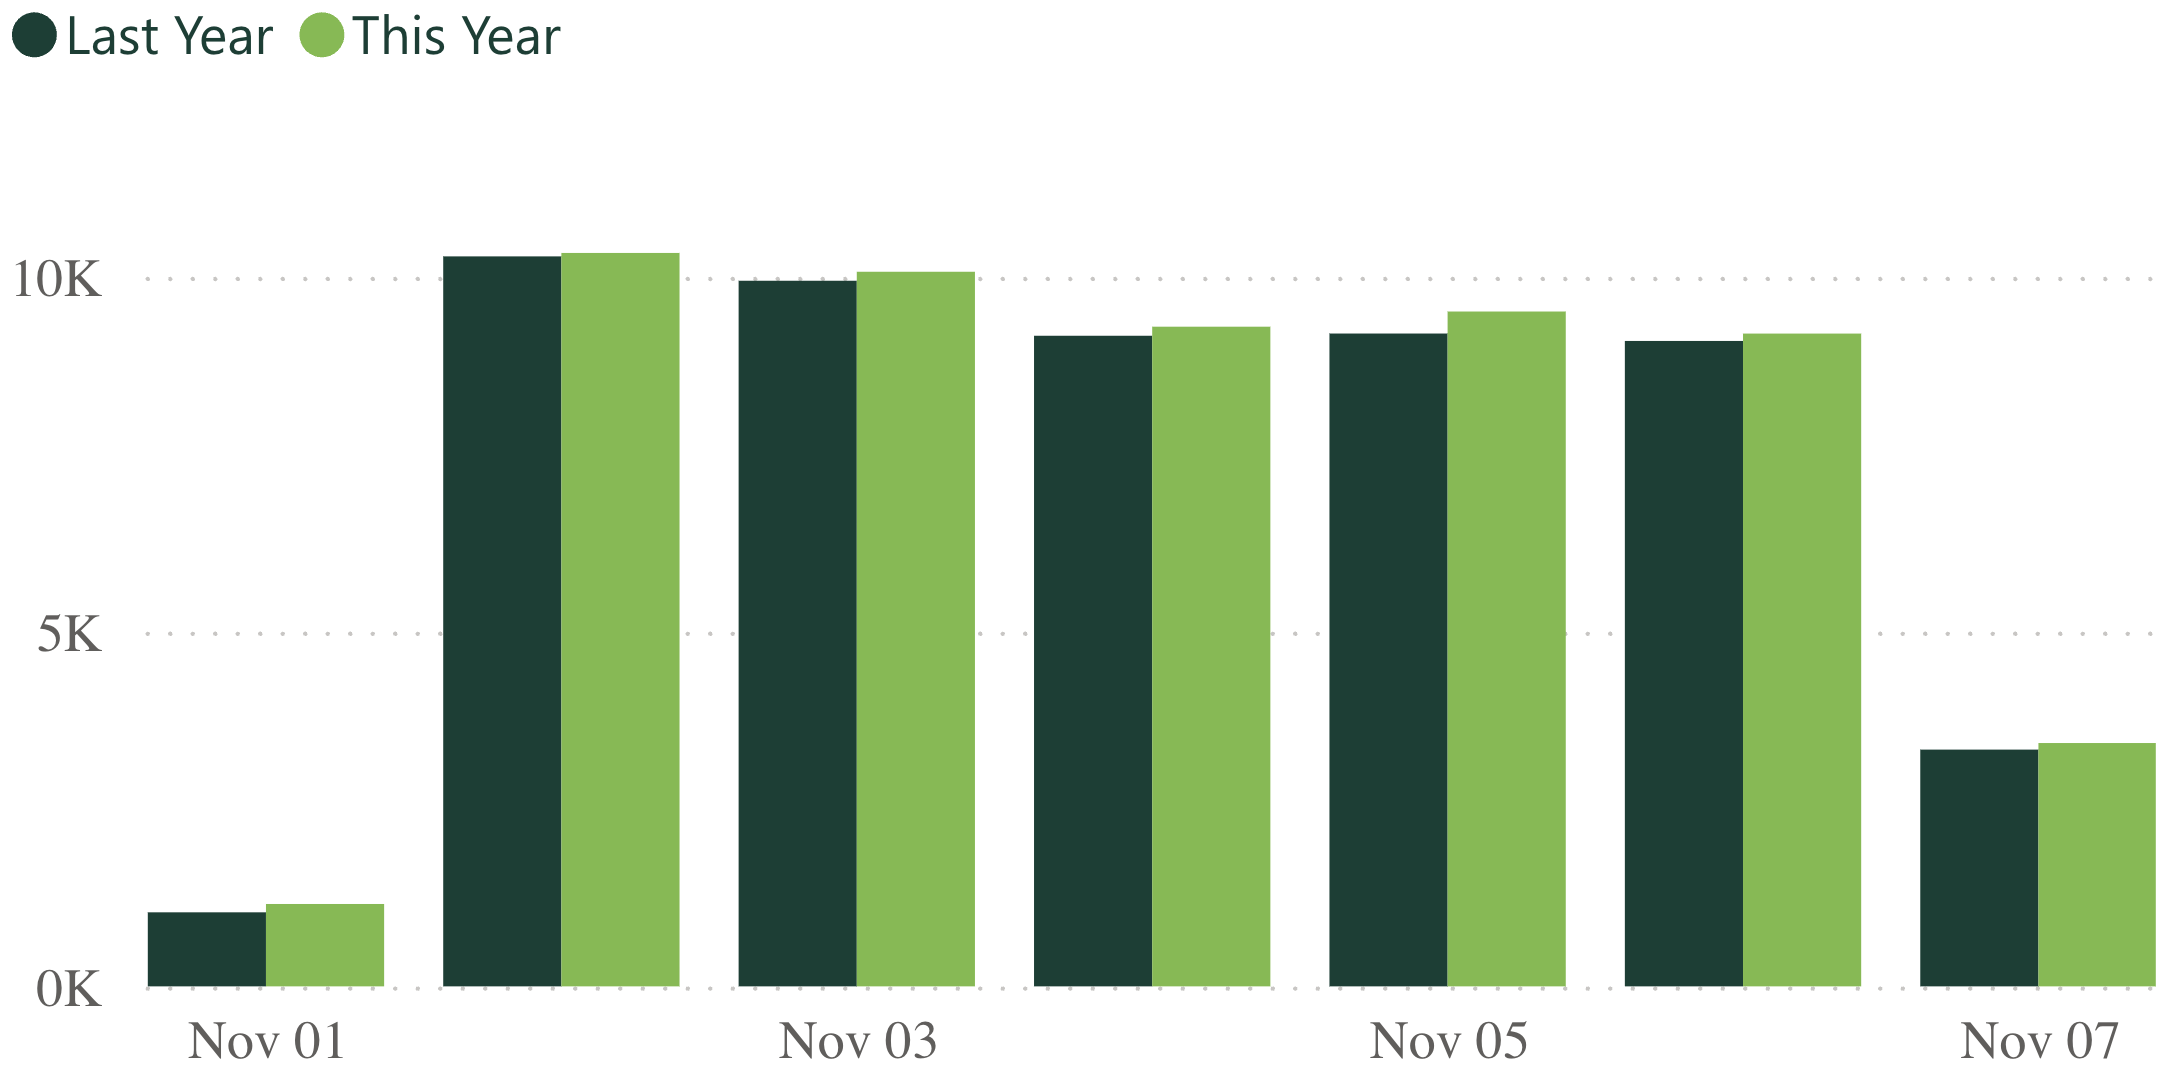
Industry revenue and visits decreased this week compared to the week prior, with revenue decreasing from 2.7% to 1.8%, and visits slightly dipping from -1.5% to -1.9%.
 -9.1% Heartworm YoY |
-6.7% Flea/Tick YoY |
 2.7% Services YoY |
-1.8% Products YoY |
Heartworm, services, and products all slightly dipped last week compared to the week prior. Heartworm decreased from -8.7% to -9.1%, services moved from 3.7% to 2.7%, and products decreased from -1.4% to -1.8%.
Meanwhile, flea/tick increased from -7.6% to -6.7% in the same time period.
| +3.4% Revenue YoY (Last 12 Months) |
-2.0% Visits YoY (Last 12 Months) |
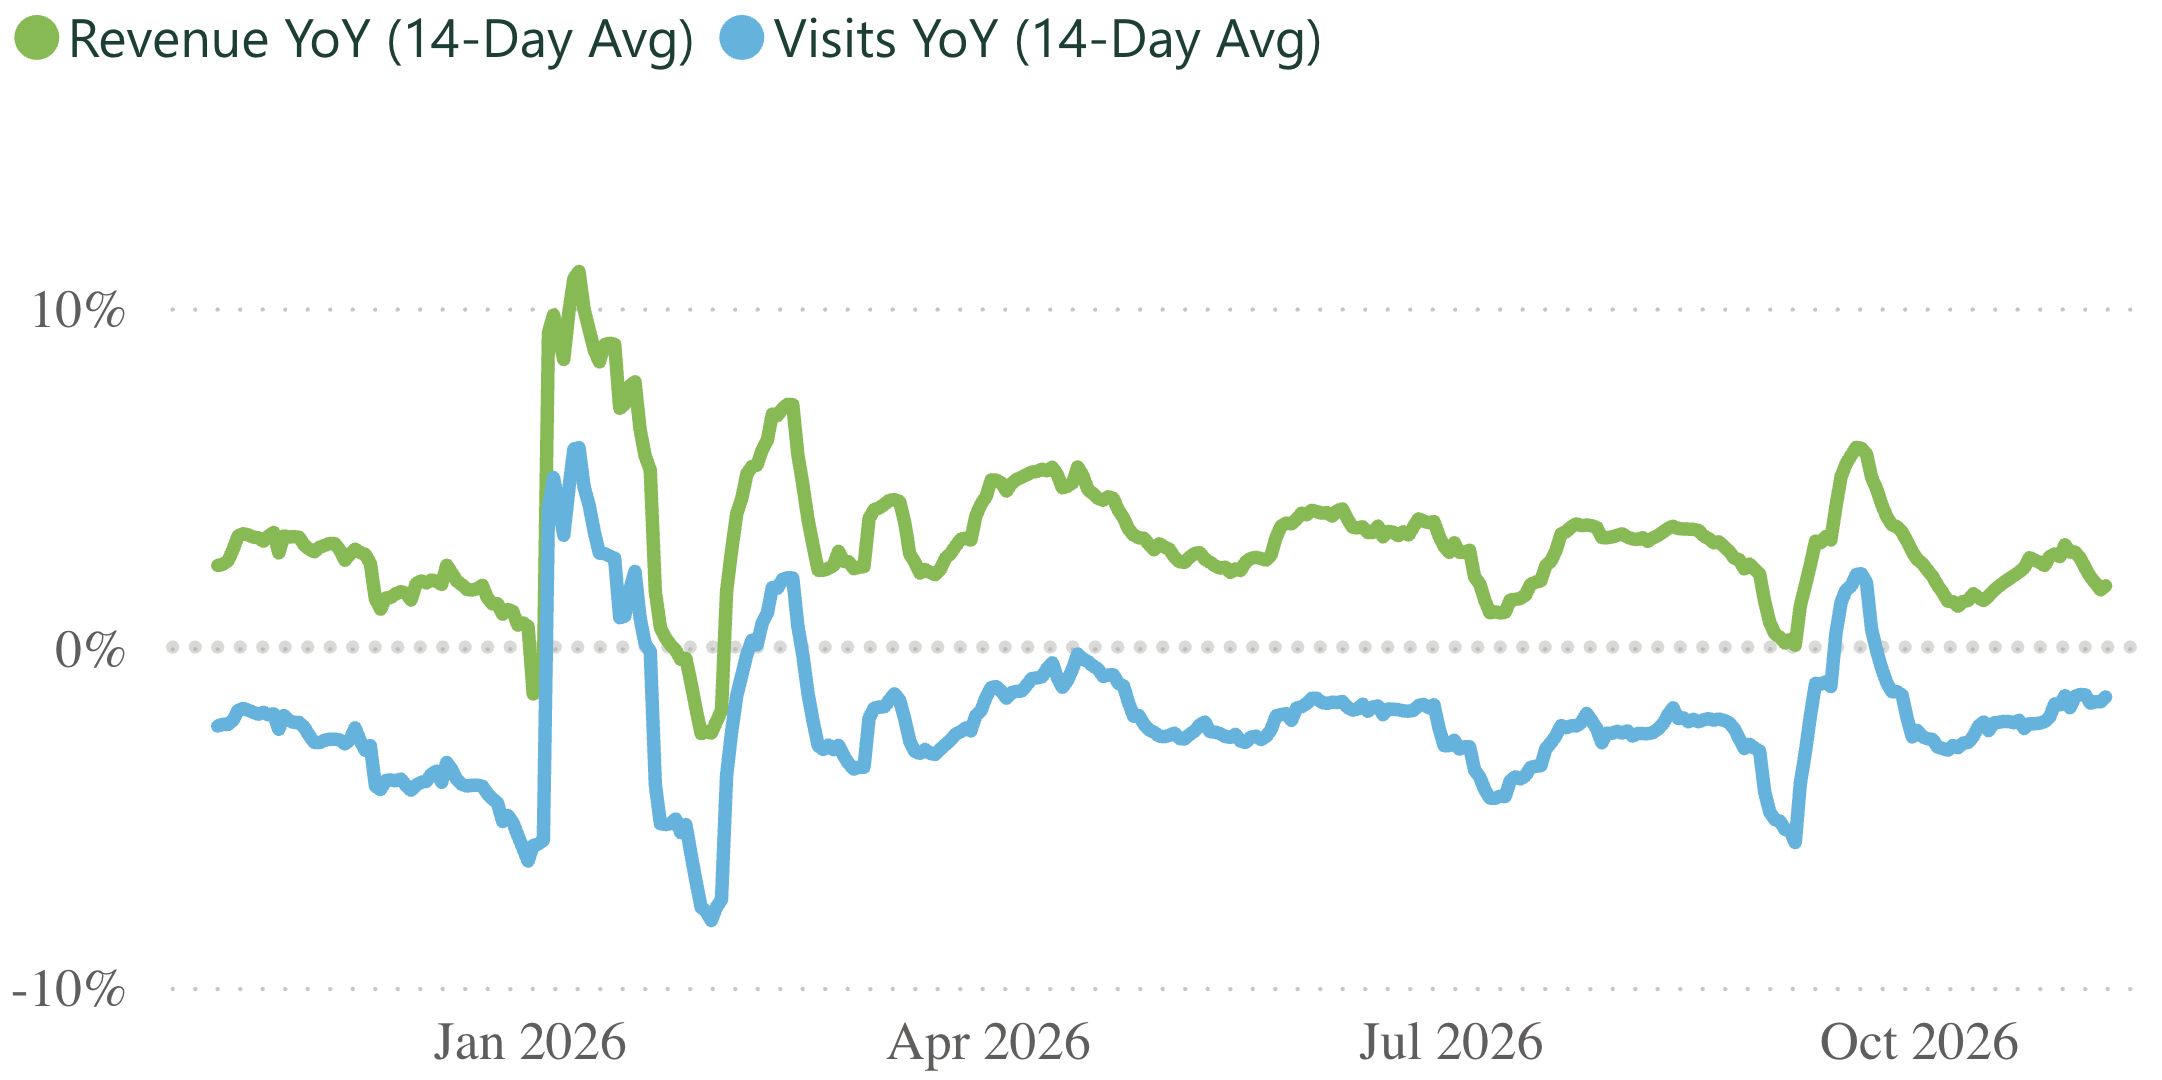
The 12-month trendlines show revenue dipping and visits holding steady since the end of October.
| 6,346 Practices |
2.1M Revenue per practice (Last 12 months) |
9.6K Visits per practice (Last 12 months) |
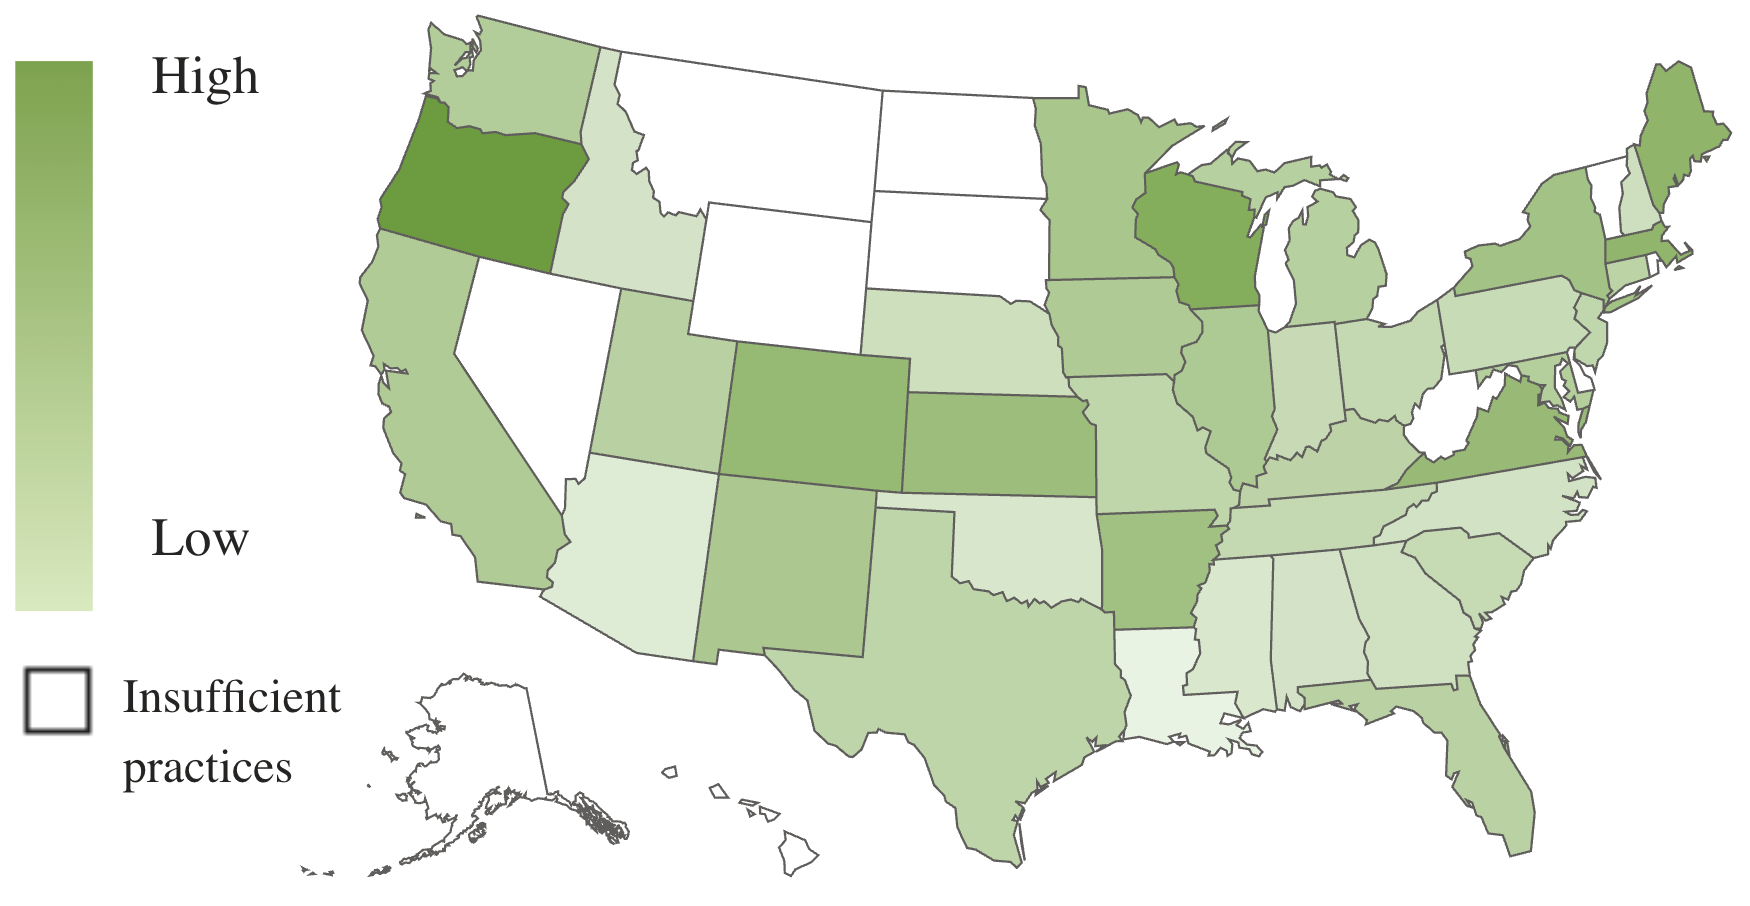
Oregon holds its lead in revenue growth at 7.5%, with Wisconsin in second at 6.1%. Massachusetts and Maine are tied for third at 5.5%.
Oregon continues to be the only state with positive YoY visits, at 1.9%.
*Numbers are subject to change based on data availability and PIMS adjustments.

Need additional stats? You got it.
The Premium Veterinary Industry Tracker lets you drill into revenue categories, visit types, date ranges, states, and more.
| LEARN MORE »(opens in new tab) [3] |