Stats from the Veterinary Industry Tracker powered by Vetsource and the AVMA
Nov 27-Dec 3, 2022
A few critical trends in veterinary medicine are weighing on our minds this week. When evaluating what’s causing the known decrease in visits, we see many factors contributing simultaneously: level setting from exceptional 2021 performance, economic headwinds and reduced pet owner spending, plus workforce shortages meaning fewer available appointments. In addition, based on what we’re hearing from practices, a cultural and attitudinal shift may also be impacting performance and should not be overlooked. As more veterinarians prioritize mental health and work life balance, their expectations for hours worked and cases they’re willing to see may continue to accelerate the reduction in visits.
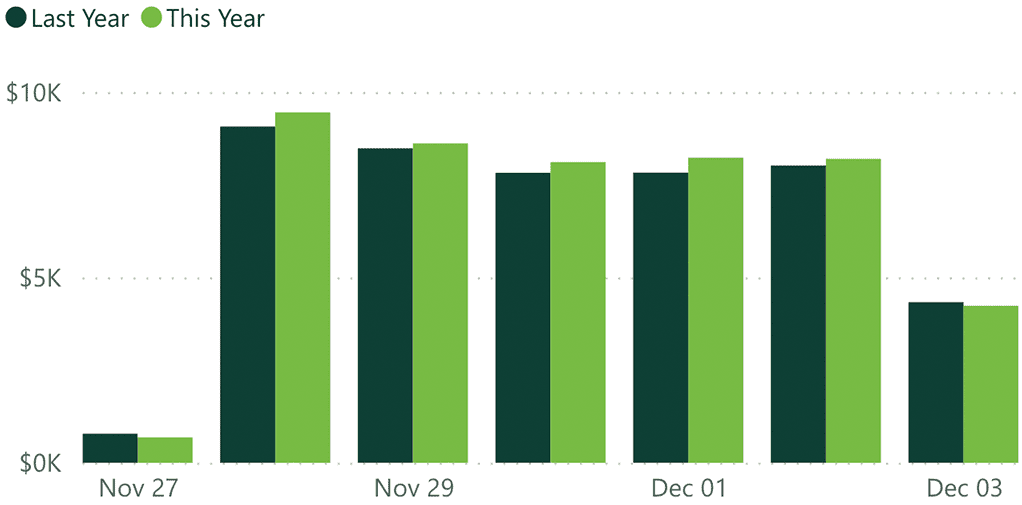
Last week: U.S. veterinary practices saw year-over-year revenue growth of 2.7% and -4.7% growth in visits.
You can see more details below and check out the Veterinary Industry Tracker [1] for daily stats.
| +2.7% Revenue YoY (Last Week) |
-4.7% Visits YoY (Last Week) |
Revenue growth was up again this past week at 2.7% year-over-year, which is a little lower than what we have seen recently. Visits are still down at -4.7% year-over-year this past week, even lower than the week before.
Heartworm YoY |
Flea/Tick YoY |
Services YoY |
Products YoY |
Heartworm and flea/tick protection dispensed and product revenue are still down year-over-year, and lower this week than we saw last week. Revenue from services was up 4.3% compared to this week last year.
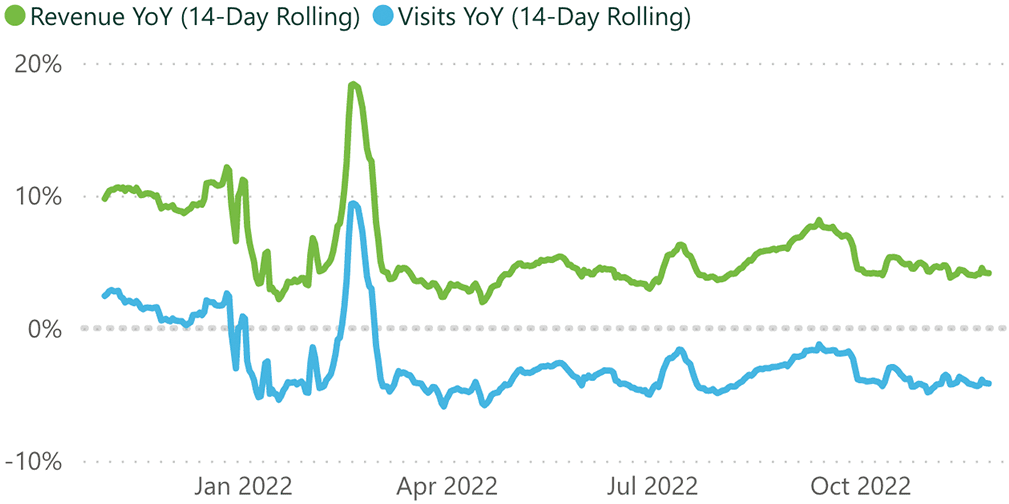
| +5.2% Revenue YoY (Last 12 Months) |
-3.1% Visits YoY (Last 12 Months) |
The rolling 14-day trendline for revenue and visits growth year-over-year for the past 12 months has been consistently down in 2022 compared to 2021. This month we saw average revenue dip below 6% where it is still at now, which is half of what we saw in April 2022. Metrics have been pretty steady over the past month, but are still gradually trending down in this 4th quarter.
| 4,556 Practices |
1.9M Revenue per Practice (Last 12 Months) |
10.6K Visits per Practice (Last 12 Months) |
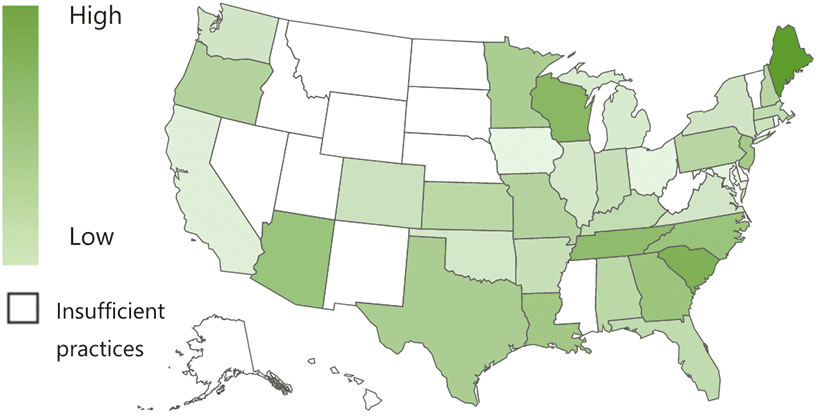
Maine is the top state for year-over-year revenue growth on average for the past 12 months, with 10.5% growth. For daily state-specific stats, please see the Premium Veterinary Industry Tracker on VeterinaryAnalytics.com. [2]
*Numbers are subject to change based on data availability and PIMS adjustments.
![]()
Need additional stats? You got it.
The Premium Veterinary Industry Tracker lets you drill into revenue categories, visit types, date ranges, states, and more.
| LEARN MORE » [2] |