Stats from the Veterinary Industry Tracker powered by Vetsource and AVMA
May 17-23, 2026
Check out the Veterinary Industry Tracker [1] for daily stats.
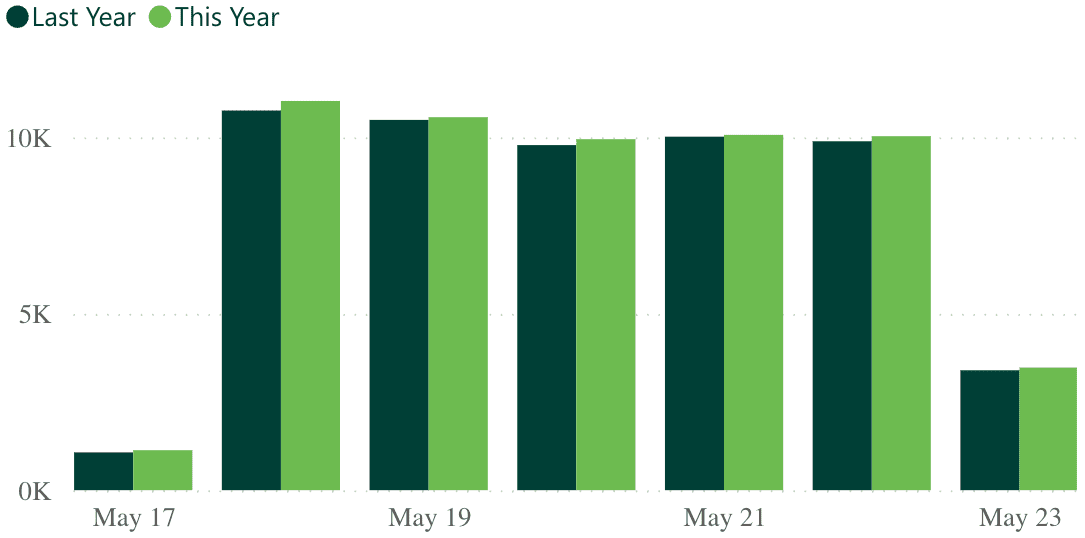
| 1.5% Revenue YoY (Last Week) |
-3.2% Visits YoY (Last Week) |
Year-over-year veterinary industry revenue and visits saw a slight boost last week compared to the prior week, with revenue increasing from 1.3% to 1.5%, and visits increasing from -3.4% to -3.2%.
 -6.7% -6.7%Heartworm YoY |
-2.8% Flea/Tick YoY |
 2.4% 2.4%Services YoY |
-1.6% Products YoY |
Preventatives and products also experienced a small increase last week compared to the week prior, with heartworm rising from -7.1% to -6.7%, and flea/tick going up from -4.6% to -2.8%. Products saw a slight boost from -2.4% to -1.6%.
Services saw no change and remained at 2.4%.
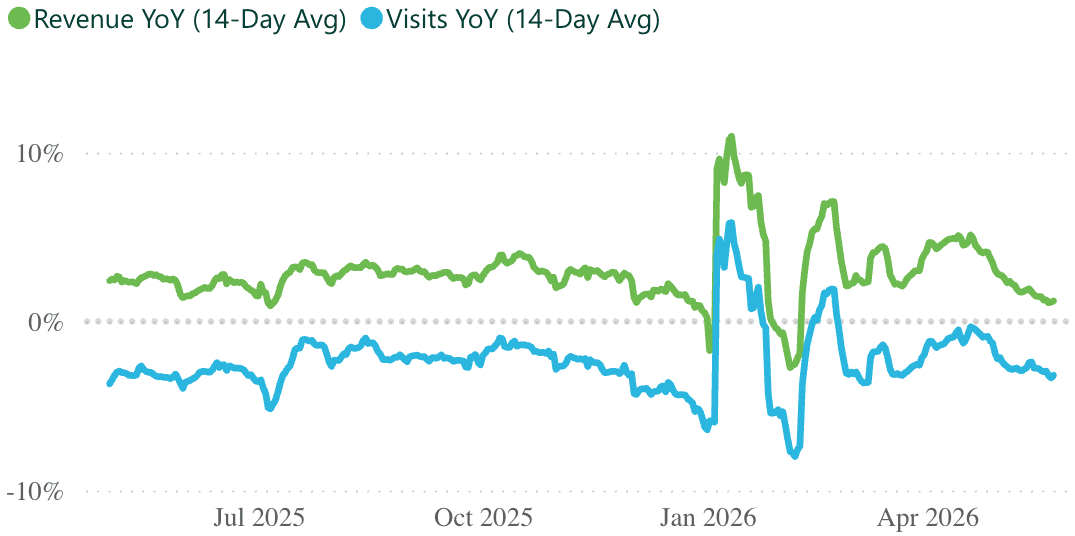
| +3.1% Revenue YoY (Last 12 Months) |
-2.3% Visits YoY (Last 12 Months) |
The rolling 14-day trendline shows revenue and visits continuing to fall since April.
| 6,600 Practices |
2.1M Revenue per practice (Last 12 months) |
9.8K Visits per practice (Last 12 months) |
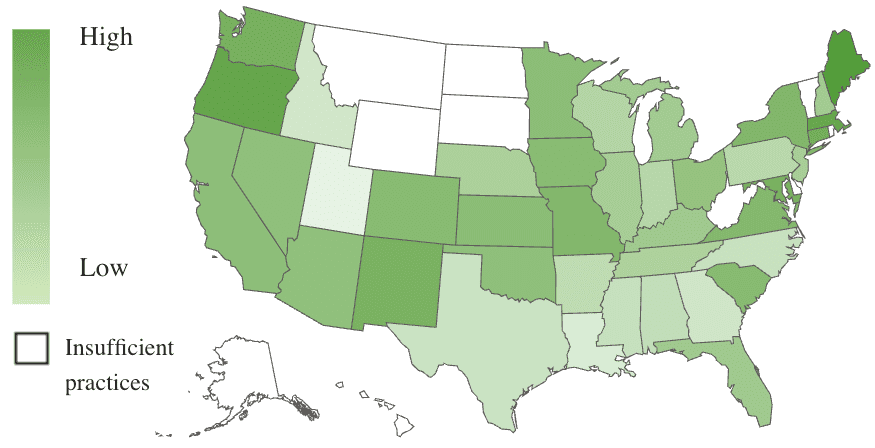
Maine leads year-over-year revenue at 5.9%, with Oregon and Massachusetts close behind at 5.3% and 5.2% respectively.
Oregon is the only state with positive year-over-year visits at 0.4%.
*Numbers are subject to change based on data availability and PIMS adjustments.

Need additional stats? You got it.
The Premium Veterinary Industry Tracker lets you drill into revenue categories, visit types, date ranges, states, and more.
| LEARN MORE » [2] |