Stats from the Veterinary Industry Tracker powered by Vetsource and AVMA
May 10-16, 2026
According to CATalyst Council [1], owning a pet now costs 32% more than it did before COVID-19. However, this increase is not spread evenly across pet spending categories. The price of veterinary services has increased at nearly twice the pace of overall inflation, and at about three times the rate of pet products.
In 2023, U.S. pet spending reached $117.6 billion, with 38.7% attributed to pet food and 30.3% attributed to services. Despite pet food making up the largest share, its cost has risen slower than overall inflation.
Cats are the most price-sensitive segment in vet care, and the burden of vet inflation has made the feline-canine care gap even larger. 33.2% of cats saw a vet in 2024 compared to 71.0% of dogs.
Check out the Veterinary Industry Tracker [2] for daily stats.
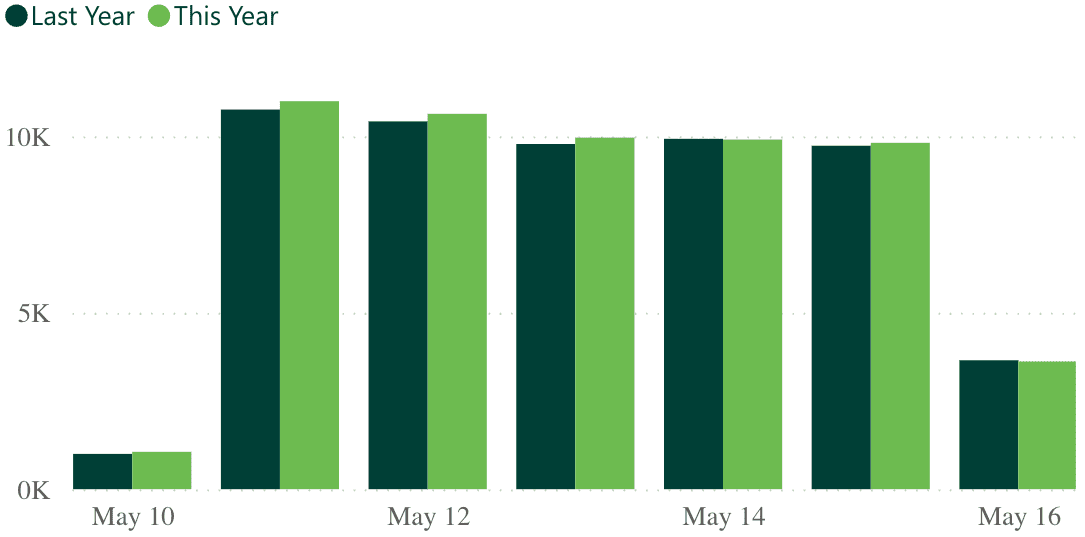
| 1.3% Revenue YoY (Last Week) |
-3.4% Visits YoY (Last Week) |
Year-over-year veterinary industry revenue slightly dropped last week from 1.4% the week prior to 1.3%. Visits also dropped from -2.8% to -3.4% in the same period.
 -7.1% -7.1%Heartworm YoY |
-4.6% Flea/Tick YoY |
 2.4% 2.4%Services YoY |
-2.4% Products YoY |
Preventatives fell last week compared to the prior week, with heartworm dipping to -7.1% from -6.8% and flea/tick taking a slight fall to -4.6% from -4.3%.
Services remained steady at 2.4% and products decreased to -2.4% from -2.0%.
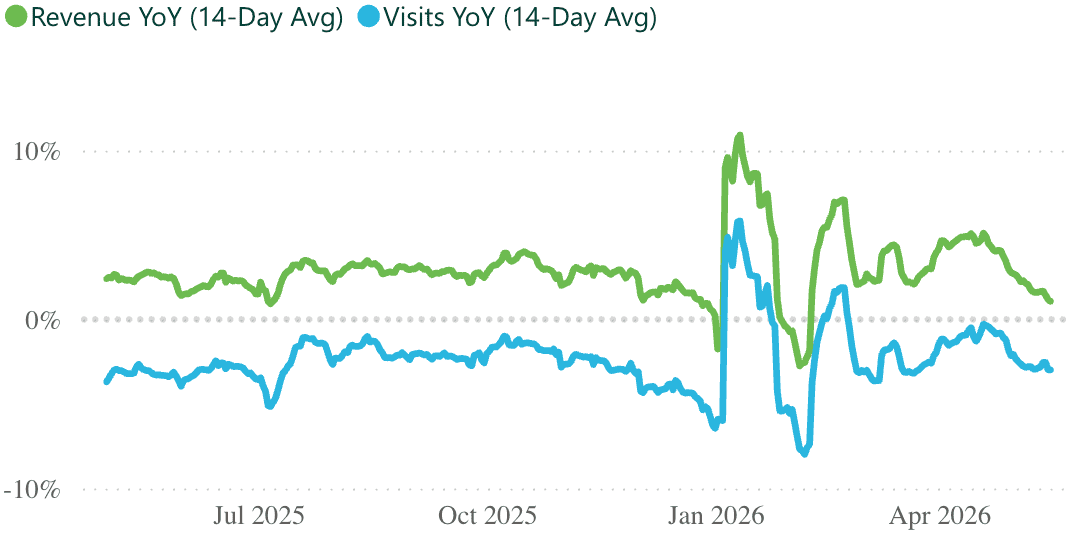
| +3.1% Revenue YoY (Last 12 Months) |
-2.3% Visits YoY (Last 12 Months) |
The rolling 14-day trendline shows revenue and visits falling since the end of April.
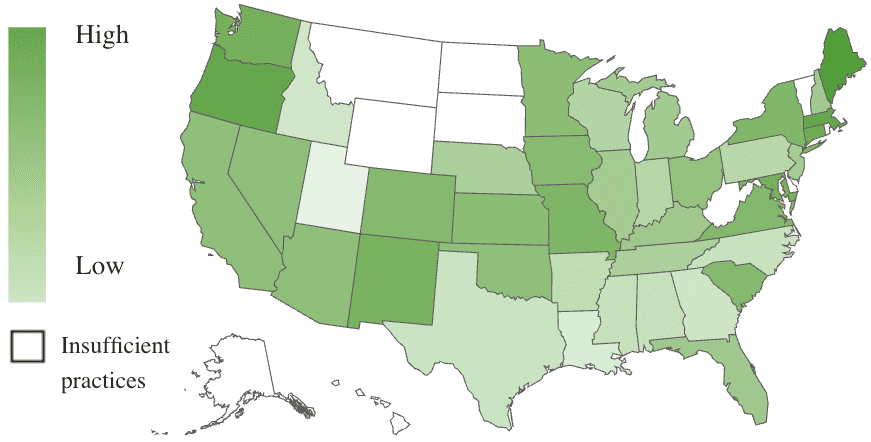
| 6,590 Practices |
2.1M Revenue per practice (Last 12 months) |
9.8K Visits per practice (Last 12 months) |
Just like last week, Maine continues to lead year-over-year revenue at 5.8%, with Massachusetts and Oregon trailing at 5.2%.
Oregon continues to be the only state with positive year-over-year visits at 0.4%, and Washington is close behind at -0.6%.
*Numbers are subject to change based on data availability and PIMS adjustments.

Need additional stats? You got it.
The Premium Veterinary Industry Tracker lets you drill into revenue categories, visit types, date ranges, states, and more.
| LEARN MORE » [3] |