Stats from the Veterinary Industry Tracker powered by Vetsource and the AVMA
Dec 4-10, 2022
Diving deeper into our veterinary practice data set, we see that in-hospital product-only purchase visits continue to have the largest decline from the prior year. These are defined as invoices that contain only drugs and medications, nutrition, or OTC products without a medical service and do not include invoices from practices’ online stores.
Concurrently, one of the leading online pet retailers released their quarterly earnings on December 8th and reported double digit growth. While the decline in well visits, sick visits, and boarding may partly be due to a level setting of very high growth in 2021, the in-hospital product-only purchase visits downward trend likely points to a pet owner shift toward home delivery. Practices should monitor this closely and proactively implement strategies to ensure product transactions are retained within their business.
Last week: U.S. veterinary practices saw year-over-year revenue growth of 3.4% and -3.3% growth in visits.
You can see more details below and check out the Veterinary Industry Tracker [1] for daily stats.
| +3.4% Revenue YoY (Last Week) |
-3.3% Visits YoY (Last Week) |
Revenue growth was up again this past week at 3.4% year-over-year, which is slightly higher than the week prior. Visits are still down at -3.3% year-over-year this past week, which is up compared to the week prior.
Heartworm YoY |
Flea/Tick YoY |
Services YoY |
Products YoY |
Heartworm and flea/tick protection dispensed are still down year-over-year, but higher than what we saw the week prior. Revenue from services was up 4.7% while revenue from products was essentially flat. Both metrics are up compared to the week prior.
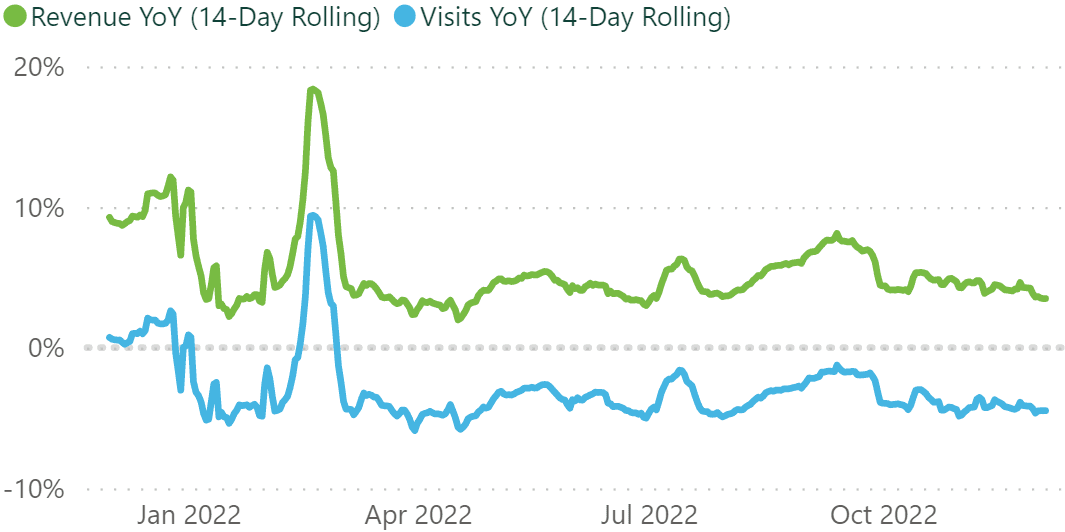
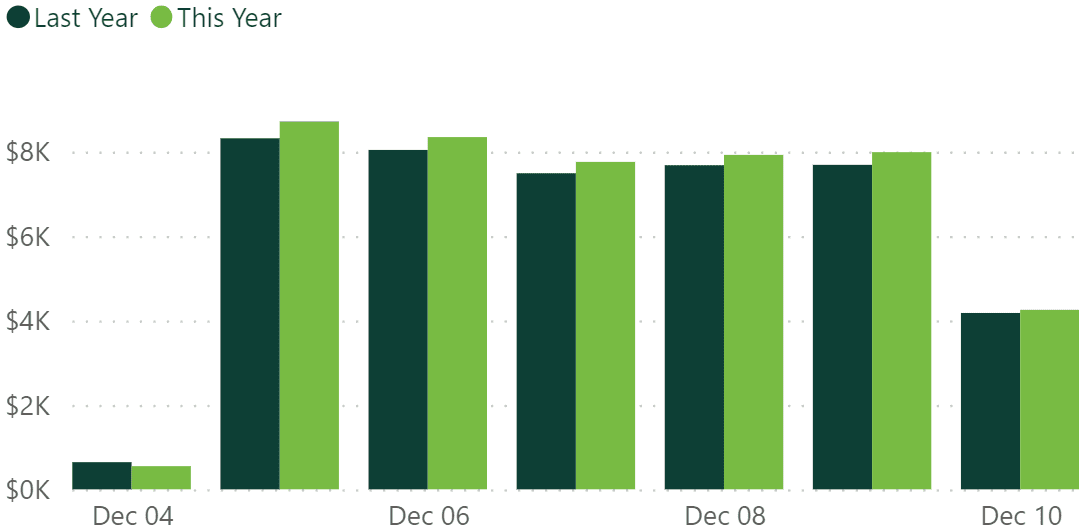
| +5.2% Revenue YoY (Last 12 Months) |
-3.1% Visits YoY (Last 12 Months) |
The rolling 14-day trendline for revenue and visits growth year-over-year for the past 12 months has been consistently down in 2022 compared to 2021. In November, we saw average revenue dip below 6%, which is half of what we saw in April. Metrics have been pretty steady, but are still gradually trending down in this 4th quarter.
| 4,548 Practices |
1.9M Revenue per Practice (Last 12 Months) |
10.6K Visits per Practice (Last 12 Months) |
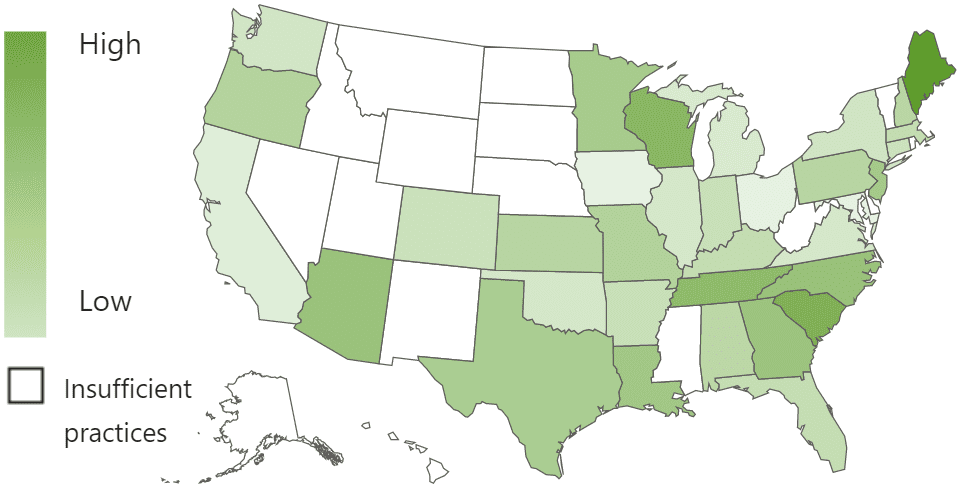
Maine is the top state for year-over-year revenue growth on average for the past 12 months, with 10.5% growth. For daily state-specific stats, please see the Premium Veterinary Industry Tracker on VeterinaryAnalytics.com. [2]
*Numbers are subject to change based on data availability and PIMS adjustments.
![]()
Need additional stats? You got it.
The Premium Veterinary Industry Tracker lets you drill into revenue categories, visit types, date ranges, states, and more.
| LEARN MORE » [2] |