 There’s no doubt that the predominant narrative in the veterinary industry today is that practices are overburdened, understaffed, and quite frankly struggling. As a veterinary data analytics company, we’re always curious about the data behind these emerging veterinary trends. Since Vetsource is connected to thousands of veterinary practices nationwide, we’re able to dig in and see what’s really going on.
Recently Sheri Gilmartin, CVT and Esther Fraser of Vetsource were asked to present these myth-busting metrics at the AVMA Veterinary Business and Economic Forum [1]. What follows here is an overview of the data they presented, just in case you missed it.
It’s important to note that while we did not look at staffing numbers for this presentation or blog post, there are certainly many practices facing staffing issues. Being a few doctors and technicians short can easily impact operations and staff morale in practices. (If that sounds like your practice, check out this article from Crista Wallis, DVM: Short-Staffed Veterinary Practice? 8 Tips to Do More With Less [2]) What follows is not meant to minimize those issues but simply analyze other potential factors contributing to the overall feeling of busyness.
Visits: Have visits increased at veterinary practices?
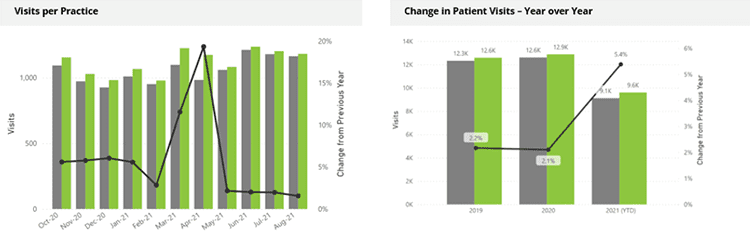
One common refrain as of late is “We’re busier than ever.” To dig into this sentiment, we first looked at the very obvious starting point of visits. Have visits increased at veterinary practices?
We looked at visits per practice in 2020 and 2021 and calculated the year-over-year percent change to get at this answer. Ignoring the sharp spike in March and April due to the early pandemic comparison timeframe, we see healthy year-over-year growth in visits—2% to 5% growth is good but not outlandish growth, not enough to account for the overburdened feeling.
Something to keep in mind is that veterinary practices rarely keep track of when clients have to be turned away due to being at capacity. Tracking the time and date of turned away visits could help shed additional light on demand for visits.
Patients: Are doctors seeing more patients each day?
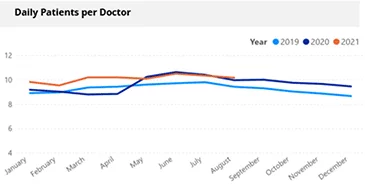
To approach this from a different angle, we next looked at patients. Are doctors actually seeing more patients each day?
We analyzed daily patients per doctor for 2019, 2020, and 2021 thus far for medical services at general practices only. Again we see strong growth, about 6% to 7.5% year-over-year, but not extreme growth. It works out to be about three extra patients in a four-day span. This may seem manageable but according to AVMA practice owner survey data from April and July 2020, productivity is down almost 25%.
Patients: Is the influx new or returning patients? #pandemicpuppy
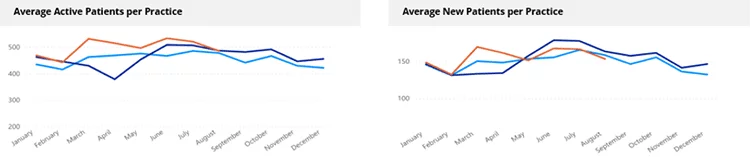
People love alliteration, am I right? The concept of a “pandemic puppy” has really taken root in the zeitgeist since the start of COVID-19. This is the idea that large swaths of people made the leap into pet ownership while stuck at home during the pandemic. While this may be true for some, it’s certainly not as intense as the media portrays [3] it to be, and certainly not enough to be solely responsible for a veterinary industry-wide crisis.
Vetsource data confirms modest (read: ordinary) growth in new patients per practice, about 3.5% year-over-year. However—and this is why we love data so much—we did see a greater increase in active patients per practice, about 8% year-over-year. Essentially, the real story is that existing pets are coming back more often and that’s driving growth more than visits from new pets (whether the client is new or not).
Wellness vs. sick visits: What’s bringing people and pets in?
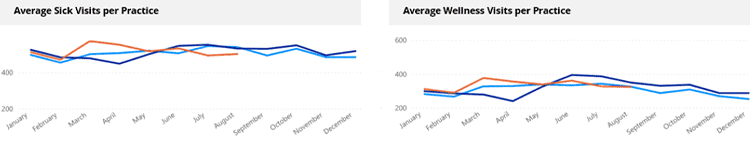
While sick visits consistently account for the majority of overall visits at veterinary practices, since the pandemic we’ve seen strong growth in wellness visits—about 5% to 7%—compared to modest growth in sick visits—about 2% to 3%. This accounts for about 17-21 additional wellness visits per month and 10-15 additional sick visits per month.
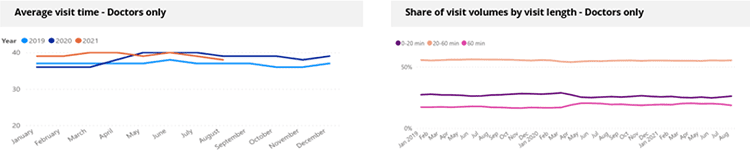
Length of appointments: Are appointments just taking longer?
Circling back to productivity, veterinary practices across the country had to adopt new safety protocols to operate during the pandemic. New processes such as curbside service interrupted the standard flow of many veterinary practices, and, as you may have guessed, impacted the length of appointments.
For this metric, we calculated appointment time as the length of time between the scheduled appointment start and the invoice close. We excluded surgeries, services that require hospitalization, boarding, and grooming. The startling finding here is that the share of appointments that took over an hour increased by 2 percentage points and, correspondingly, the share of appointments that took 20 minutes or less decreased by the same amount. Essentially, this is like trading in 2% of your appointments from quick-and-easy for over-an-hour. If you have 100 appointments in a week, about 55 of them are going to be 20-60 minutes, 35 of them are under 20 minutes, and 10 are over an hour. Now, in the pandemic, you have 33 that are under 20 minutes and 12 that are over an hour—that’s an extra hour and a half (possibly more!) just from those “swapped” appointments.
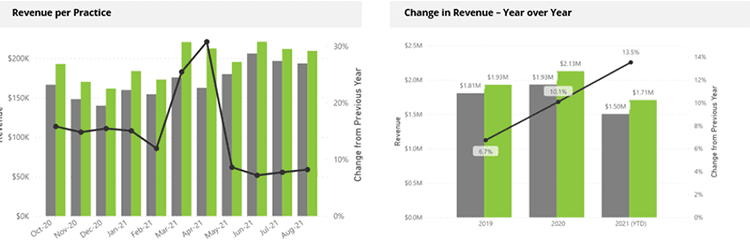
Revenue: How is this all impacting the bottom line?
Even with all the challenges facing veterinary medicine today, it’s still a tremendous time for growth in the industry. We’re seeing year-over-year growth in revenue go from 6.7% in 2019 to about 10% in 2020 and 13.5% so far in 2021.
Much of this revenue growth [4] is coming from existing clients, not new clients or new pets. Clients are actually spending more per veterinary visit than in prior years. The number of line items per visit has expanded, clients are opting for higher-value products and services, and average prices have continued to increase as well. The increase in prices, however, is making only a small contribution to revenue growth overall. Prices increase at about 4% (and have for years), but the revenue growth far outstrips that.
How can practices adjust to these emerging veterinary trends?
For practices feeling the burn of these trends, it’s time to work smarter, not harder. The industry-wide workforce challenges aren’t going away any time soon so now is the time to pivot and try new strategies.
Embrace technology to automate and streamline tasks. Be sure to evaluate your daily appointment schedule and look for opportunities to adjust as needed. Consider telehealth and tech-only appointments, exam room scribes, client engagement apps [5], 2-way texting, drop-offs, and even relief vets [6] or remote employees.

Kate Zirkle is a Marketing Manager for Vetsource. She is passionate about animal rescue, personal development, and travel. When not working to advance the veterinary industry, she can be found kayaking, reading, and planning her next trip. You can reach her at [email protected] [7].