What does the year after the beginning of a pandemic look like? Are practices inching closer to back to normal or leaning more into a new normal? In the same way veterinary practices were still enduring shocks and adjustments to daily life in 2021, veterinary data in 2021 has COVID-19’s fingerprints all over it. But that doesn’t mean there wasn’t some exceptional recovery in 2021 as well.
Sound a bit contradictory? Then let’s have a closer look at some of the key performance indicators by category for the veterinary industry. The data and statistics below are from the Veterinary Industry Tracker [1].
Veterinary Industry Statistics, 2021

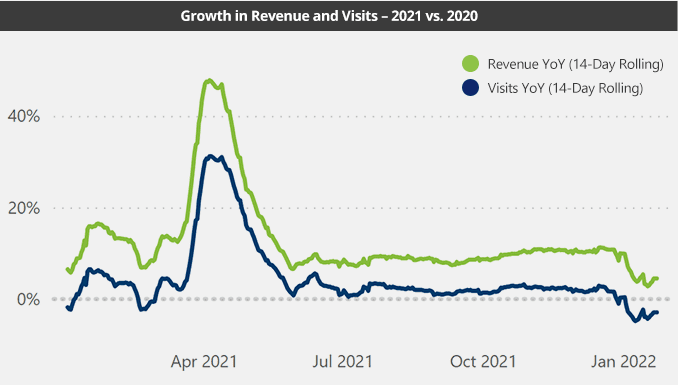
Let’s begin with year-over-year growth for revenue and visits in 2021. With our new tracker, we’re able to look with a “finer-toothed comb” this time. In both visits and revenue, we can see a huge improvement over last year, looking mountainous in March. Remember, however, that this is compared to March 2020, where we saw a huge trough thanks to COVID-19.
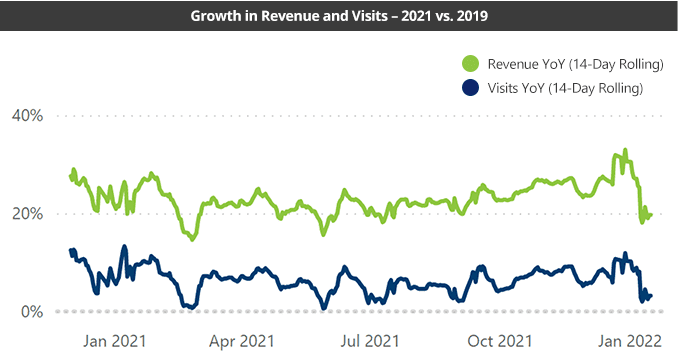
To get a better sense of what 2021 might have looked like against a normal year, we can compare it directly to 2019 instead:

When we look at 2021 compared to 2019, we can see that growth figures have stabilized when we’re not comparing them to a year with a “COVID-19 bump.” There is still some turbulence, but it’s worth noting that there is no pronounced “Omicron trough” as you might expect. We may see a small one in early 2022.
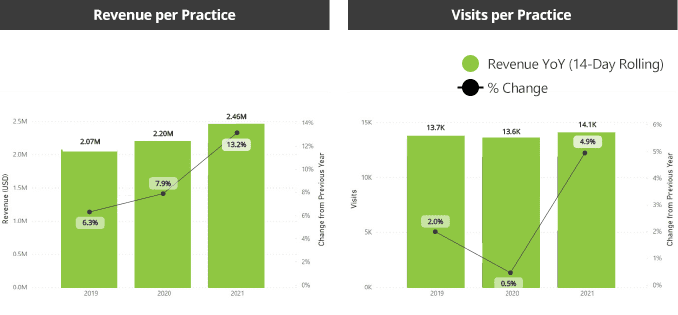
Overall, 2021 revenue is up 13% and visits are up almost 5% compared to 2020. When we put this together with data from the last 3 years, it helps us understand the pandemic’s longer-term impact:

If 2020 was about slower growth and a loss of visits, 2021 is about steeper climbs and recovery. Visits, in particular, have bounced back compared to last year. It’s important to note the totals here, as well as the percentages—we’d expect 2021 to climb sharply after the trials of 2020, but these figures show good growth against a “normal” year such as 2019.
Revisiting Category-Specific Stats, 2021

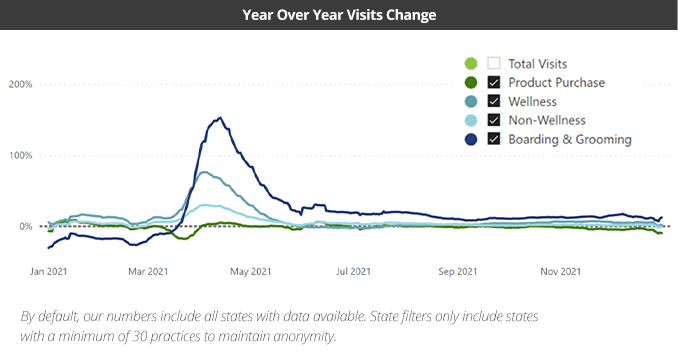
Where did this 5% visit recovery come from? Looking at year-over-year figures for before and after March gives us a convenient window into how growth stacks up to pre and post-pandemic figures.
Boarding & Grooming has the loudest story. It has the highest peak because it suffered the most losses last year. The fact that January-March 2021 still has negative changes in visits shows us that this visit type still hasn’t fully recovered to pre-pandemic levels, but is instead slowly recovering compared to a bad year in 2020.
Product Purchase visits show a small dip in early March, because unlike 2020, there was no rush to stockpile products. This type of visit fluctuated throughout the year but hovered near 2020 figures for the rest of the year—potentially because product-purchase visits were not as heavy-hit last year as other types of visits. It may also indicate that product-purchase visits are recovering timidly as the pandemic continues to affect clinics.
Wellness Visits (service visits with vaccines) also tell us a story about recovery. In 2020, these visits plummeted the most, and bounced back the hardest. As a result, in 2021 this type of visit did better in march but hovered in negative growth for the rest of the year. As with boarding and grooming, January-March figures tell us 2021 is seeing growth compared to pre-pandemic.
Non-Wellness Visits (service visits without vaccines) most closely reflect the overall visit trend, and are the clearest example of overall recovery. 2021 outperformed January and February 2020, and also consistently grew compared to the turbulence of the pandemic. It is safe to say this is the primary type of visit that “bounced back” consistently in 2021.
2021 year in review: A patchy return to the norm
This year’s data can be tough to read in the wake of a turbulent 2020, but overall the outlook is positive: the industry continues to grow in its ability to provide care and compensate for obstacles. Not all services are recovering equally, but growth remains the rule. While things may not feel “back to normal” at an individual clinic, numbers are returning to prior growth. As for the lagging types of visits, we’ll have to see in 2022.

Peter Francis is a Data Analyst for Vetsource. Having studied anthropology, psychology, and game design, Peter is no stranger to how statistics can tell human stories. Before Vetsource, he tried his hand at government research, editorial writing, and campus radio—so he’s eager to try anything and see problems from any angle.